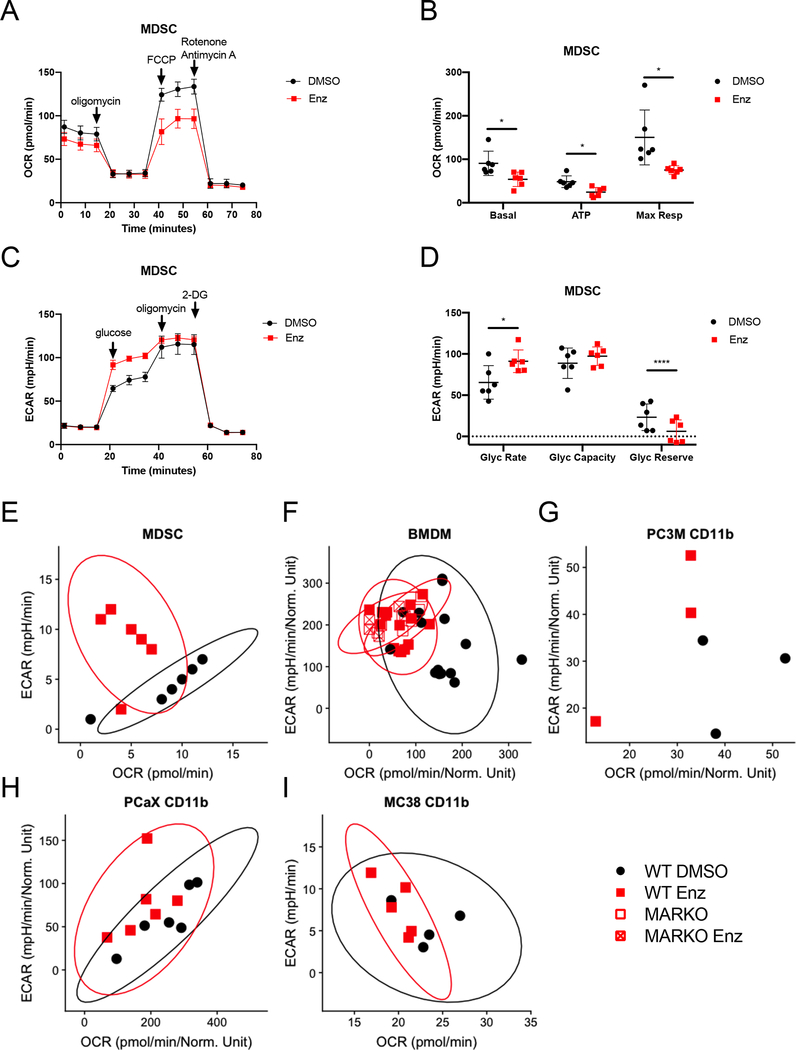
Figure 4. Enzalutamide increased glycolysis and reduced mitochondrial respiration in myeloid cells.
(A-E) MDSCs were generated in DMSO or enzalutamide conditions and were assessed by Seahorse MitoStressTest (A, B) and GlycoStressTest (C, D). Graph indicates mean and standard deviation for mitochondrial respiration test (A) and its calculated parameters (B). Graph indicates mean and standard deviation for glycolytic test (C) and its calculated parameters (D). Metabolic profile plots depict glycolytic rate and basal mitochondrial respiration values from WT MDSCs generated in vitro in the presence of DMSO or enzalutamide (E), in vitro DMSO or enzalutamide treated WT and MARKO BMDMs (F), tumor-associated CD11b+ cells from PCaX (G), and tumor-associated CD11b+ cells from PC3M (H) for 24h. (I) Plot depicts metabolic profile plot from CD11b+ cells sorted from MC-38 tumor-bearing C57BL/6 males that were treated daily with saline or 20mg/kg enzalutamide in vivo through oral gavage. Plots were made from pooled data of 1–3 experiments of 3 biological replicates per group. Ellipses from E, F, G, I and J were estimated with ggplot2 in R. Black filled dots denote DMSO treated, red filled squares indicate enzalutamide-treated, red empty squares indicate MARKO and red crossed squares indicate enzalutamide-treated MARKO myeloid cells. Plots indicate mean and standard deviation. Statistical analyses were performed with paired tests. *p<0.05, ****p<0.0001.

