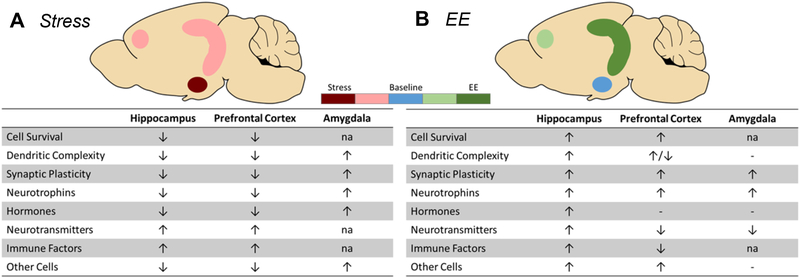
Figure 3: Independent effects of EE and stress alone in corticolimbic regions.
Summary of the effects of (A) stress and (B) EE alone on various morphological and molecular endpoints. Coloring reflects the intensity of EE and stress effects in each region. ↑ = increased activity. ↓ = decreased activity. − = no change. na = no data available.

