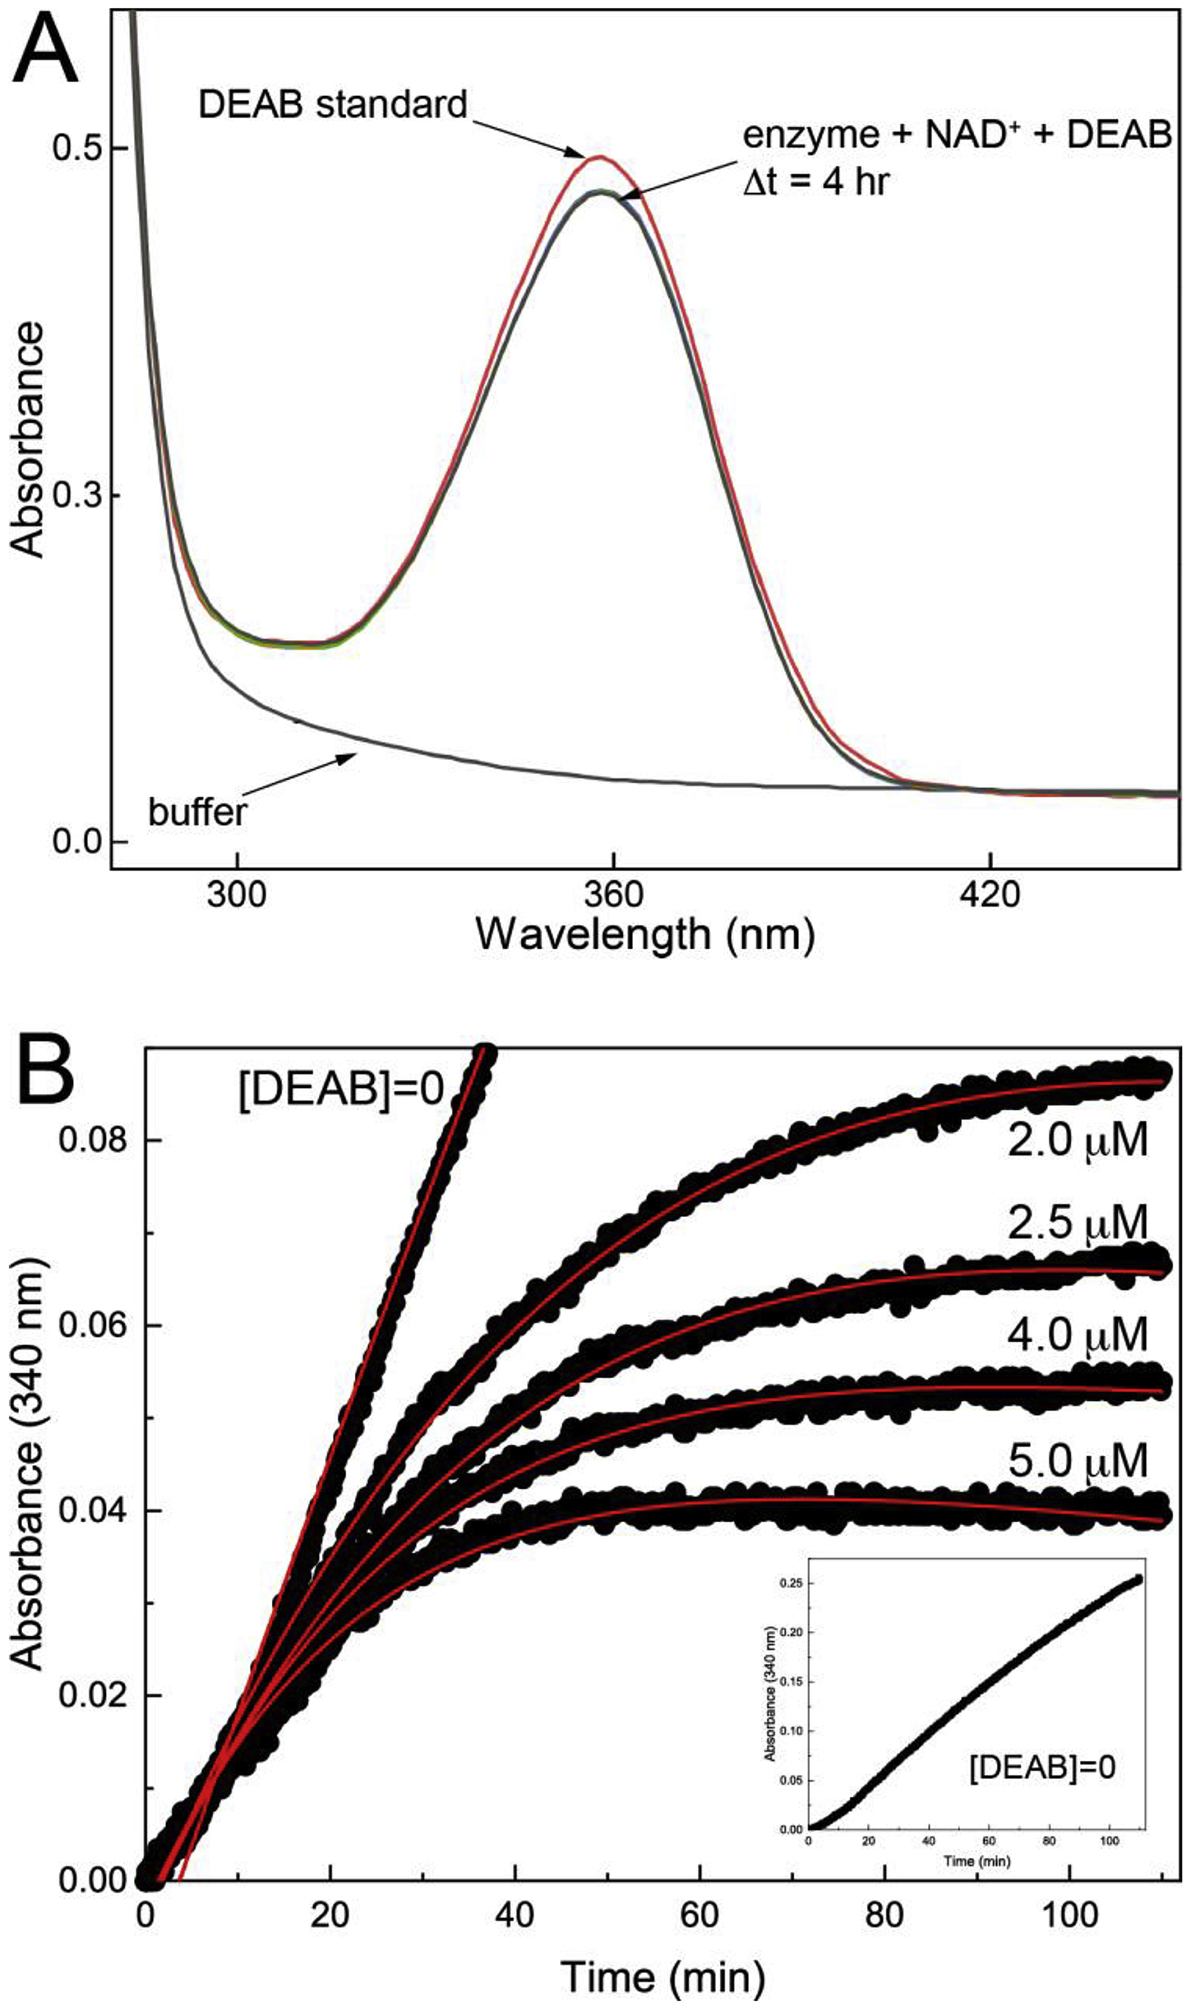
Fig. 1.

Inhibition of ALDH9A1 by DEAB. (A) Evidence that DEAB is not a substrate of ALDH9A1. ALDH9A1 (0.5 μM) was incubated with 30 μM DEAB and 1.5 mM NAD+, and spectra were collected every 10 minutes for a total of 4 hours. For reference, the red curve is the spectrum of DEAB. (B) Time-dependent inhibition of ALDH9A1 by DEAB. The black circles are experimental progress curves monitoring NADH production from ALDH9A1 in the presence of 2 mM of the aldehyde substrate hexanal, 2.5 mM NAD+, and various concentrations of DEAB. The red curves represent the global fit to combined Equations 1a and 1b. The parameters from global fitting are k5 = 0.184 ± 0.052 min−1, KI = 0.054 ± 0.018 μM. For ease of viewing, a vertical offset was applied to each data set to account for the absorbance due to the different DEAB concentrations. The inset shows the progress curve in the absence of DEAB. The unshifted progress curves with error bars are shown in Fig. S2 of Supplementary data.
