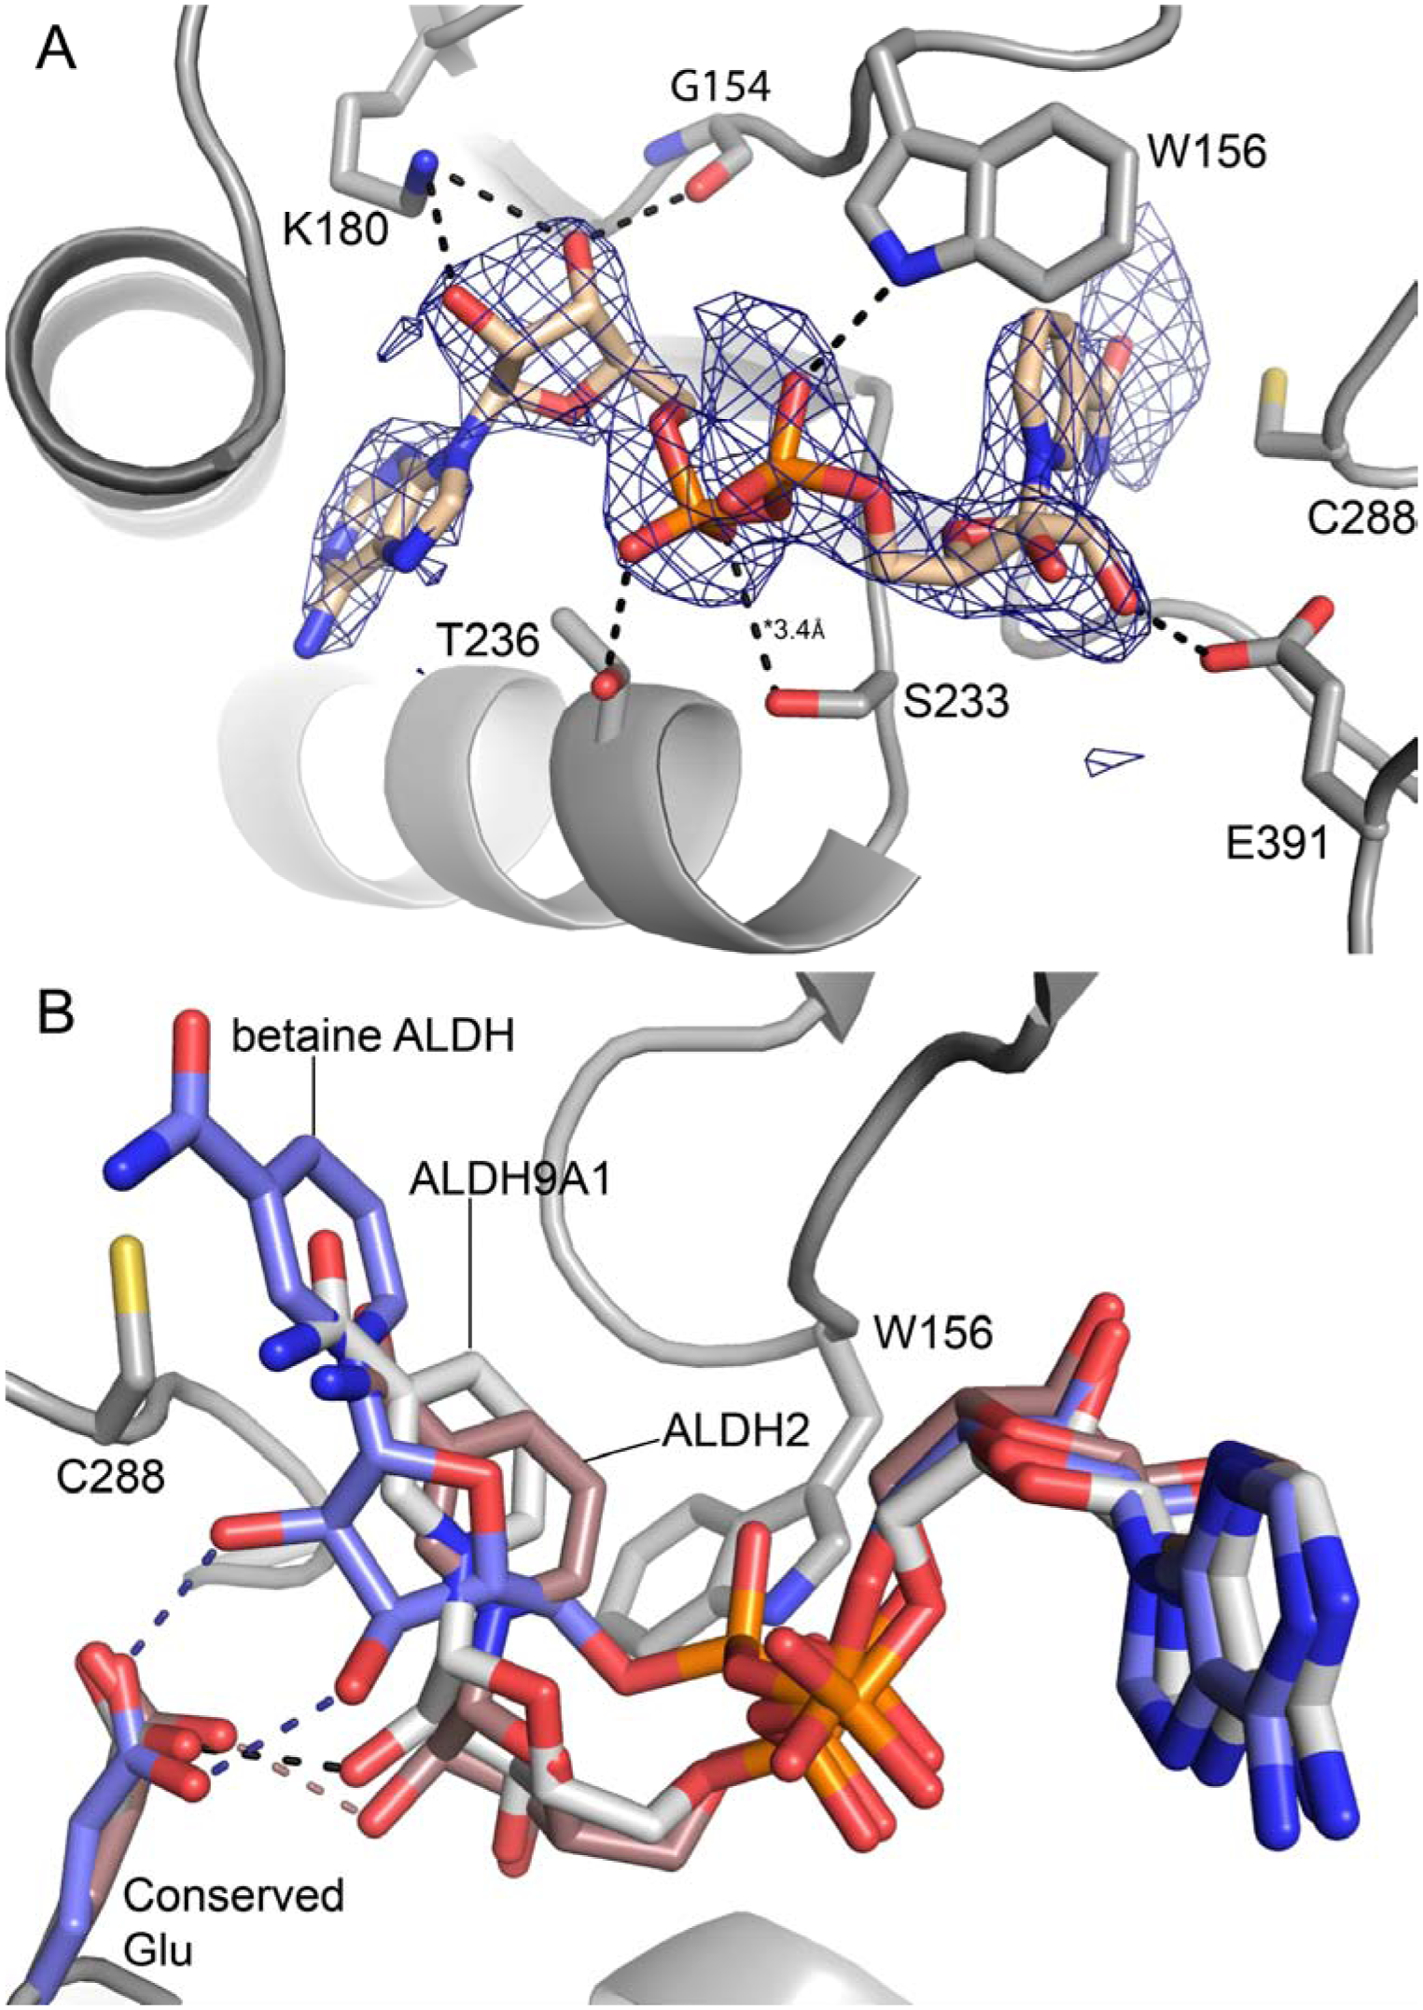
Fig. 4.

Conformation of NAD+ bound to chain A of the P1 ALDH9A1 (PDB ID: 6VR6). (A) Electron density and interactions for NAD+. The cage represents a polder omit map (3.5σ). The dashed lines indicate interactions less than 3.2 Å, except where noted. (B) Superposition of the cofactors of P1 ALDH9A1 (gray), betaine ALDH (blue, PDB ID: 1BPW), and ALDH2 (brown, PDB ID: 1O02). The betaine ALDH and ALDH2 structures show the “hydride transfer” and “hydrolysis” conformations, respectively. Hydrogen bonds with the conserved glutamate residue are colored as follows: black, ALDH9A1; blue, betaine ALDH; brown, ALDH2.
