
Figure 2: TPA-induced senescence (pre-treatment) stimulates skin tumor growth.
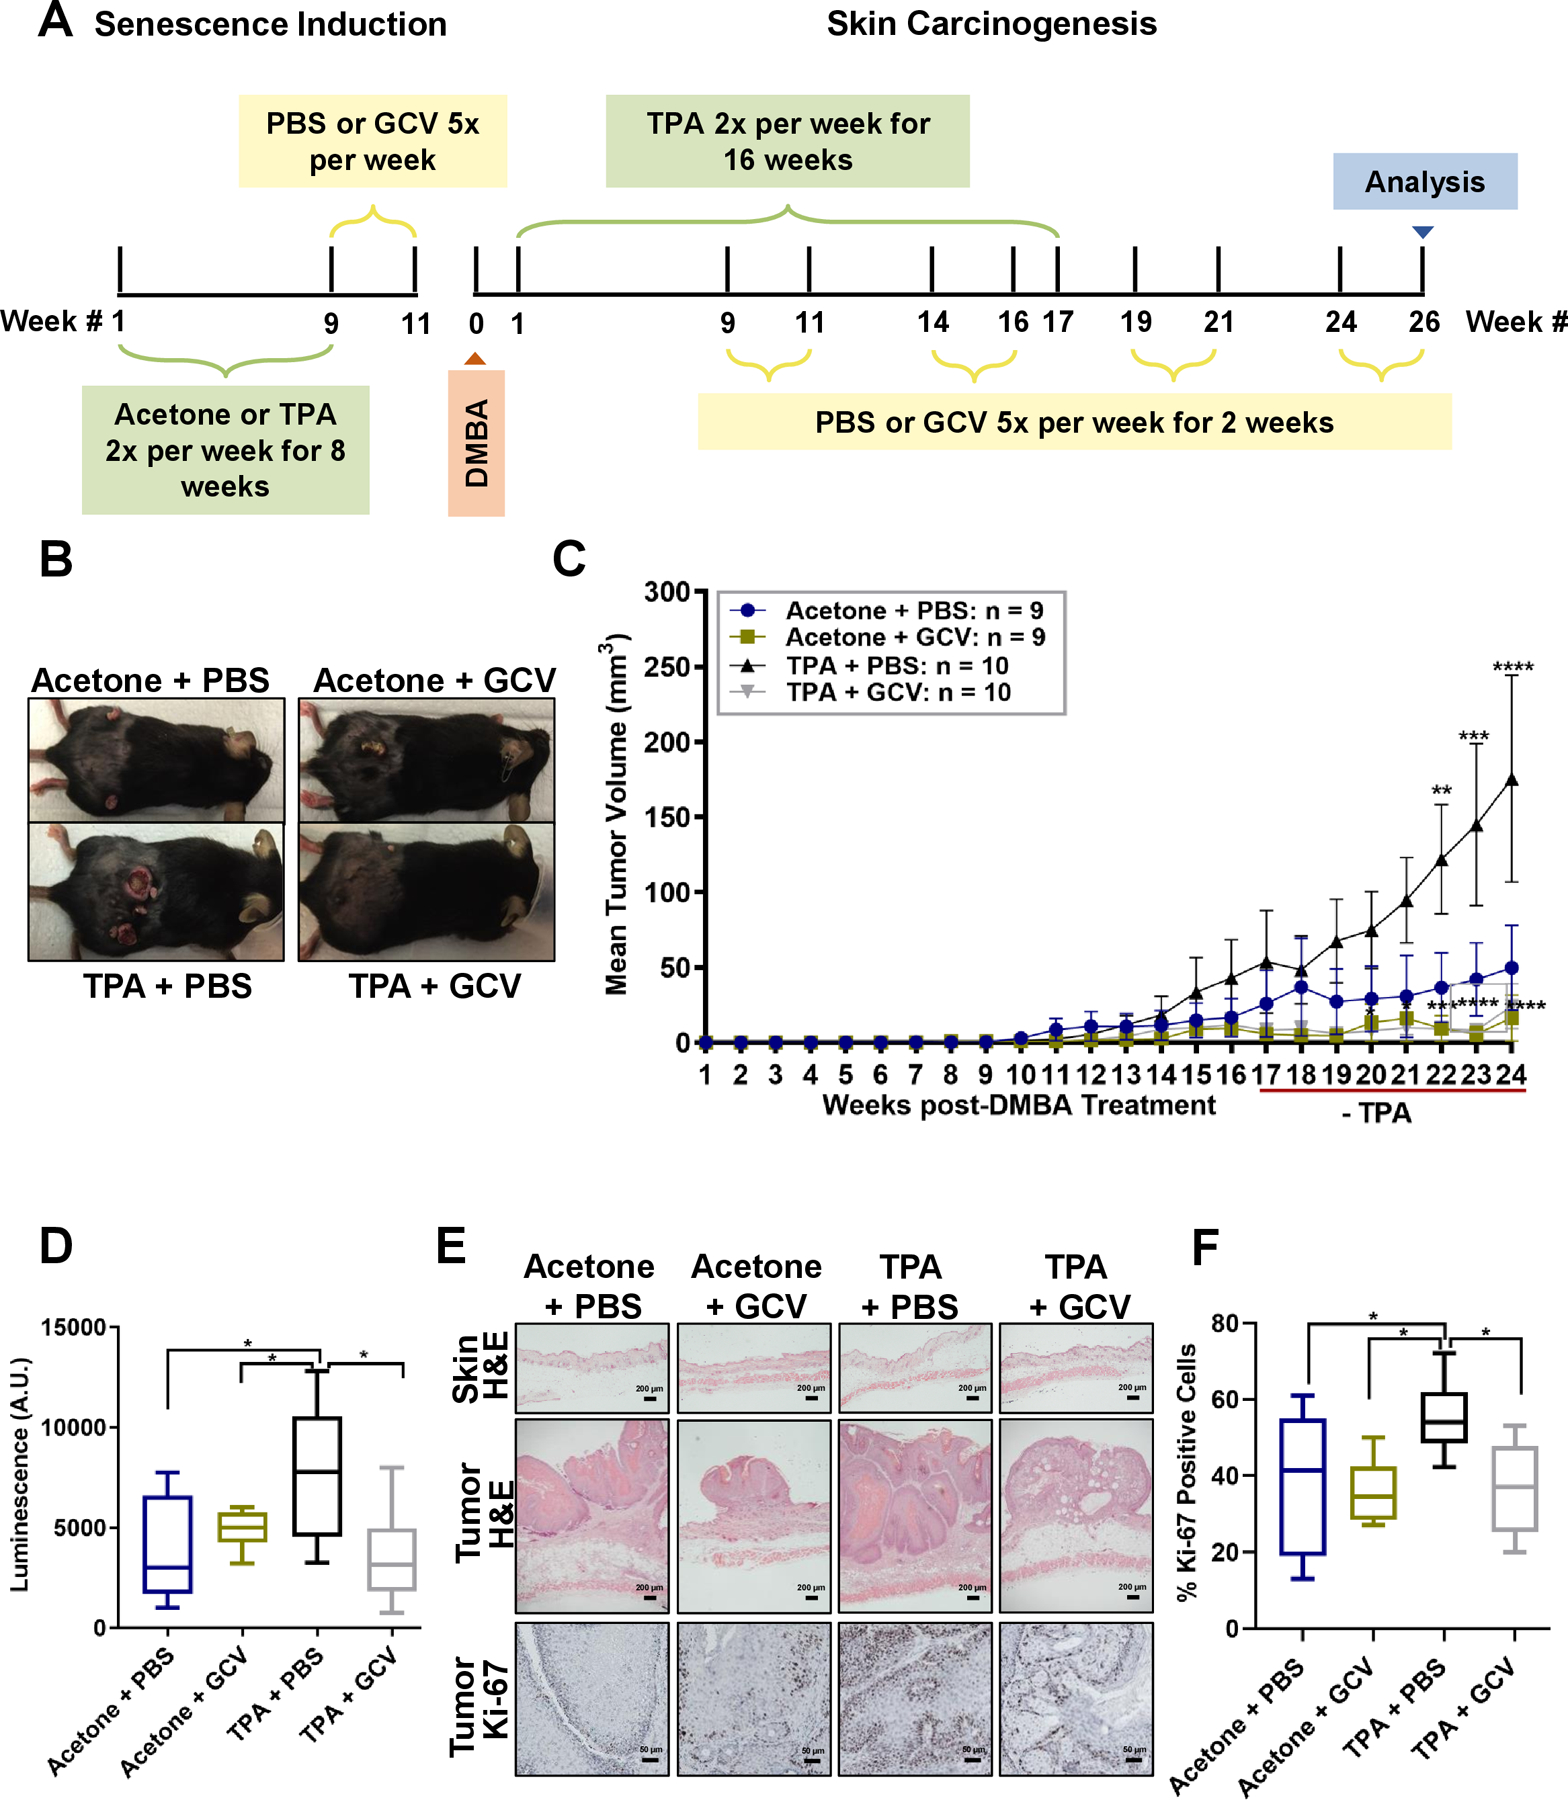
(A) Schematic of treated p16–3MR mice. (B) Representative images of tumor- bearing mice, 24 wks after DMBA treatment. (C) Tumors of Acetone + PBS, Acetone + GCV, TPA + PBS, TPA + GCV groups were monitored once a wk; mean tumor volume over 24 wks is shown. Shown are means ±SEM; **p<0.01, ***p<0.001, ****p<0.0001 (two-way ANOVA, Tukey’s test for multiple comparisons was used post-analyses). (D) Luminescence of tumor-bearing skin in arbitrary units (A.U.) units 24 wks after DMBA treatment. N = 8–10 per group. Shown are means ±SEM; *p<0.05 (one-way ANOVA, Sidak’s multiple comparisons test was used post-analyses). (E) Representative images of H&E staining of skin (top panels) and tumors (middle panels) (200 μm and 50 μm respectively), and Ki-67 staining of tumors (bottom panels) (50 μm). (F) Percentage of Ki-67-positive cells in tumors from the 4 treatment groups. Shown are means ±SEM; *p<0.05 (one-way ANOVA, Sidak’s multiple comparisons test was used post-analyses).