
Figure 4: DOXO-induced senescence fuels skin tumor growth.
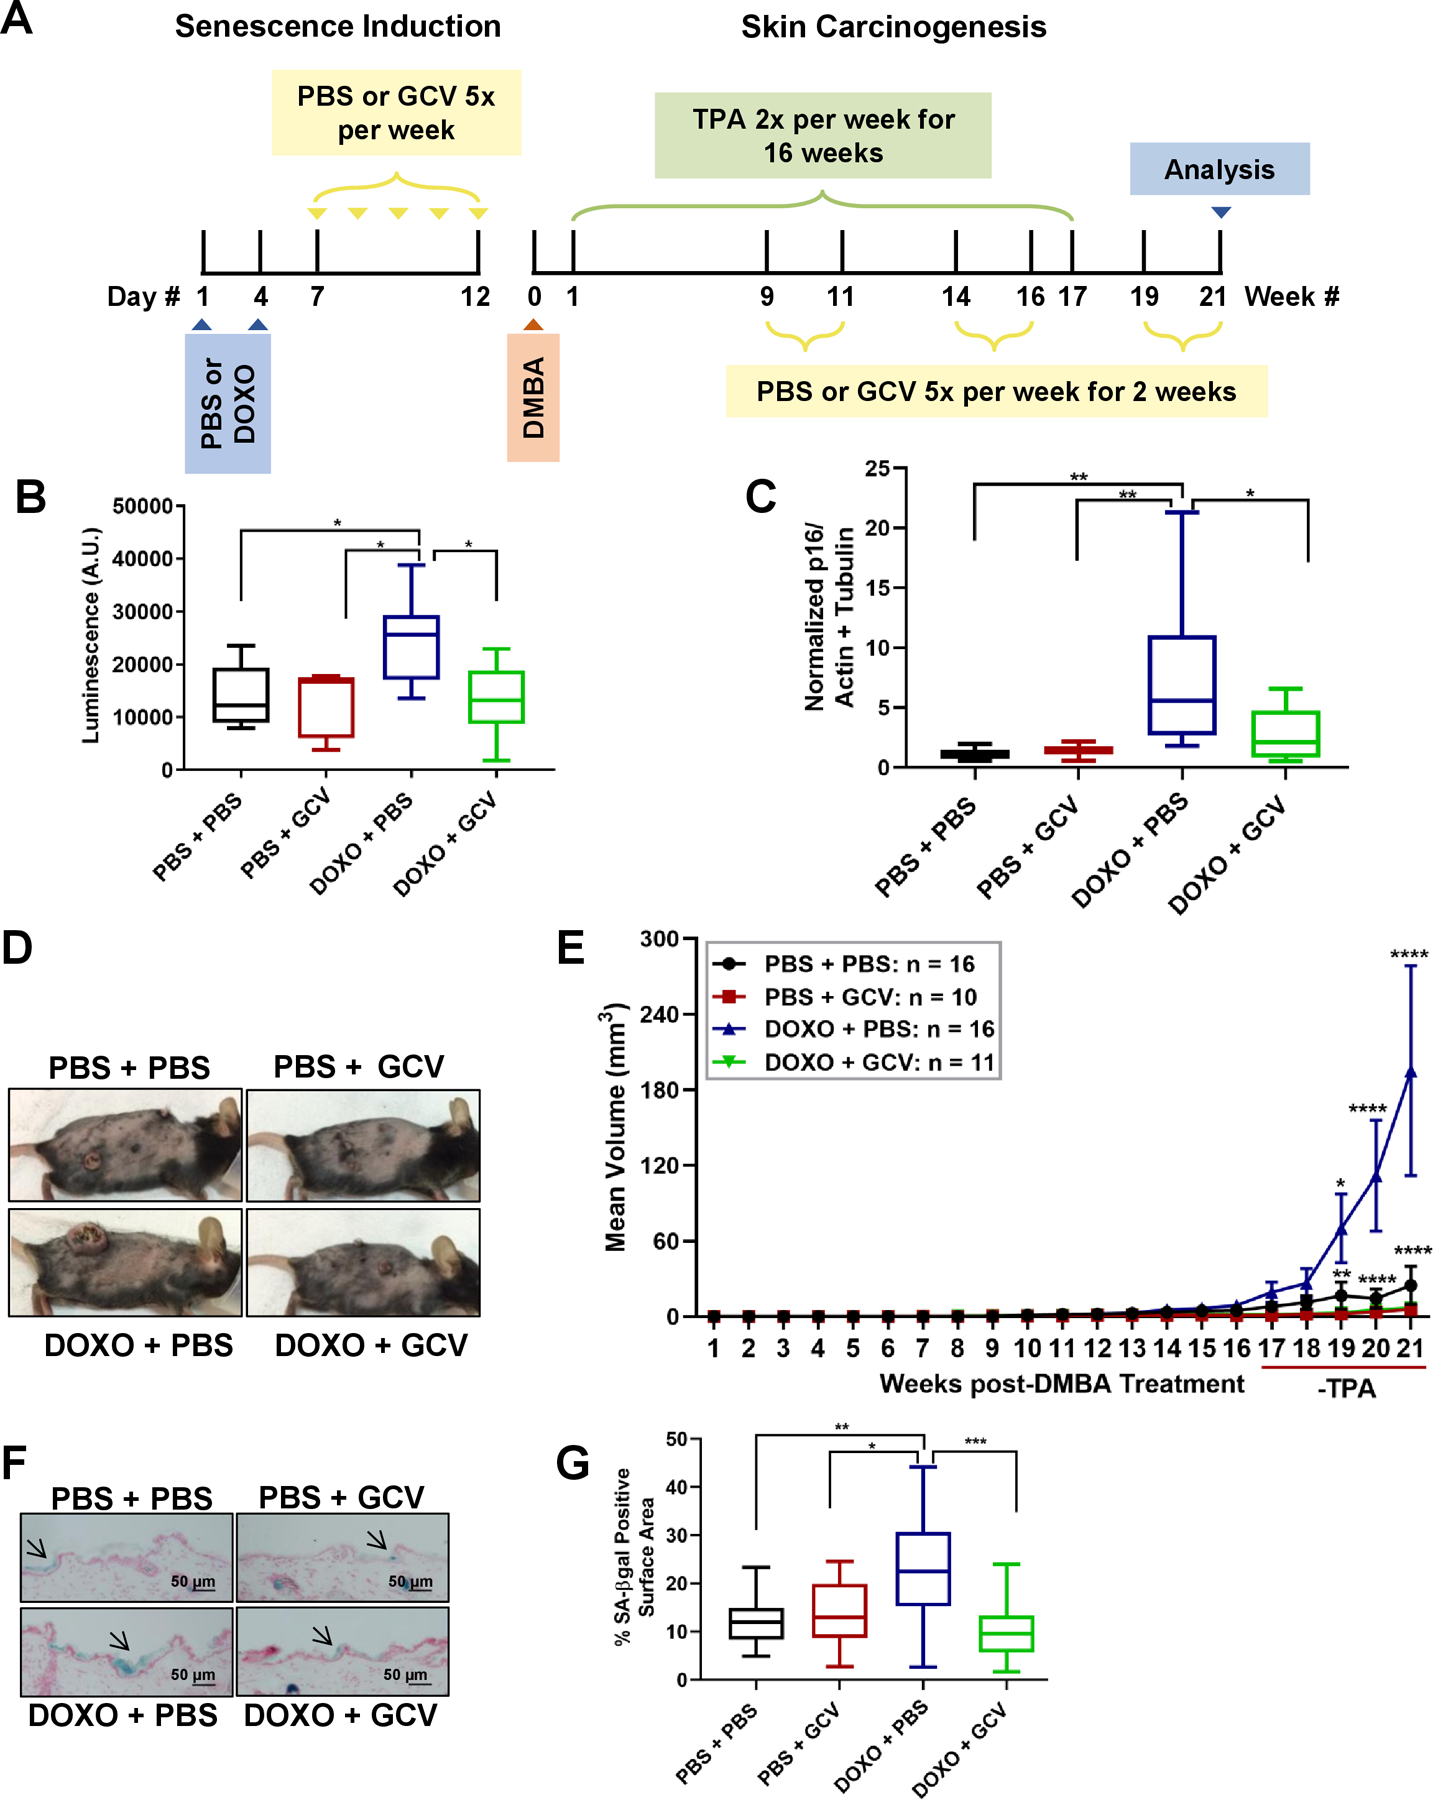
(A) A schematic of the PBS/DOXO and skin carcinogenesis regimens of p16–3MR mice. TPA treatment lasted 16 wks. (B) Quantification of whole body luminescence of p16–3MR mice 10 d after PBS/DOXO treatments and one wk after DMBA initiation. Quantification is in arbitrary units (A.U.). Shown are means ±SEM; *p<0.05 (one-way ANOVA, Sidak’s multiple comparisons test was used post-analyses). (C) Total RNA was isolated from the skin of the 4 treatments groups and analyzed for p16 normalized to actin and tubulin (PBS + PBS: n=10, PBS + GCV: n=8, DOXO + PBS: n=9, DOXO + GCV: n=8). Shown are means ±SEM; *p<0.05, **p<0.01 (one-way ANOVA, Sidak’s multiple comparisons test was used post-analyses). (D) Representative images of tumor-bearing mice 21 wks after DMBA treatment and 5 wks after TPA treatment in PBS + PBS, PBS + GCV, DOXO + PBS, DOXO + GCV groups. (E) The mean tumor volume of the same mice is shown over 21 wks. Shown are means ±SEM; *p<0.05, **p<0.01, ****p<0.0001 (two way ANOVA, Tukey’s test for multiple comparisons was used post-analyses). (F-G) Frozen skin sections of (PBS + PBS: n=10, PBS + GCV: n=10, DOXO + PBS: n=14, DOXO + GCV: n=14) treatment groups were stained for SA-ß-gal (blue) and nuclei (red). (F) Representative images are shown (50 μm), and arrows denote SA-ß-gal positive areas. (G) Percent of SA-ß-gal positive surface area of skin compared to non-stained skin. Shown are means ±SEM; *p<0.5, **p<0.01, ***p<0. 001 (one-way ANOVA, Sidak’s multiple comparisons test was used post-analyses).