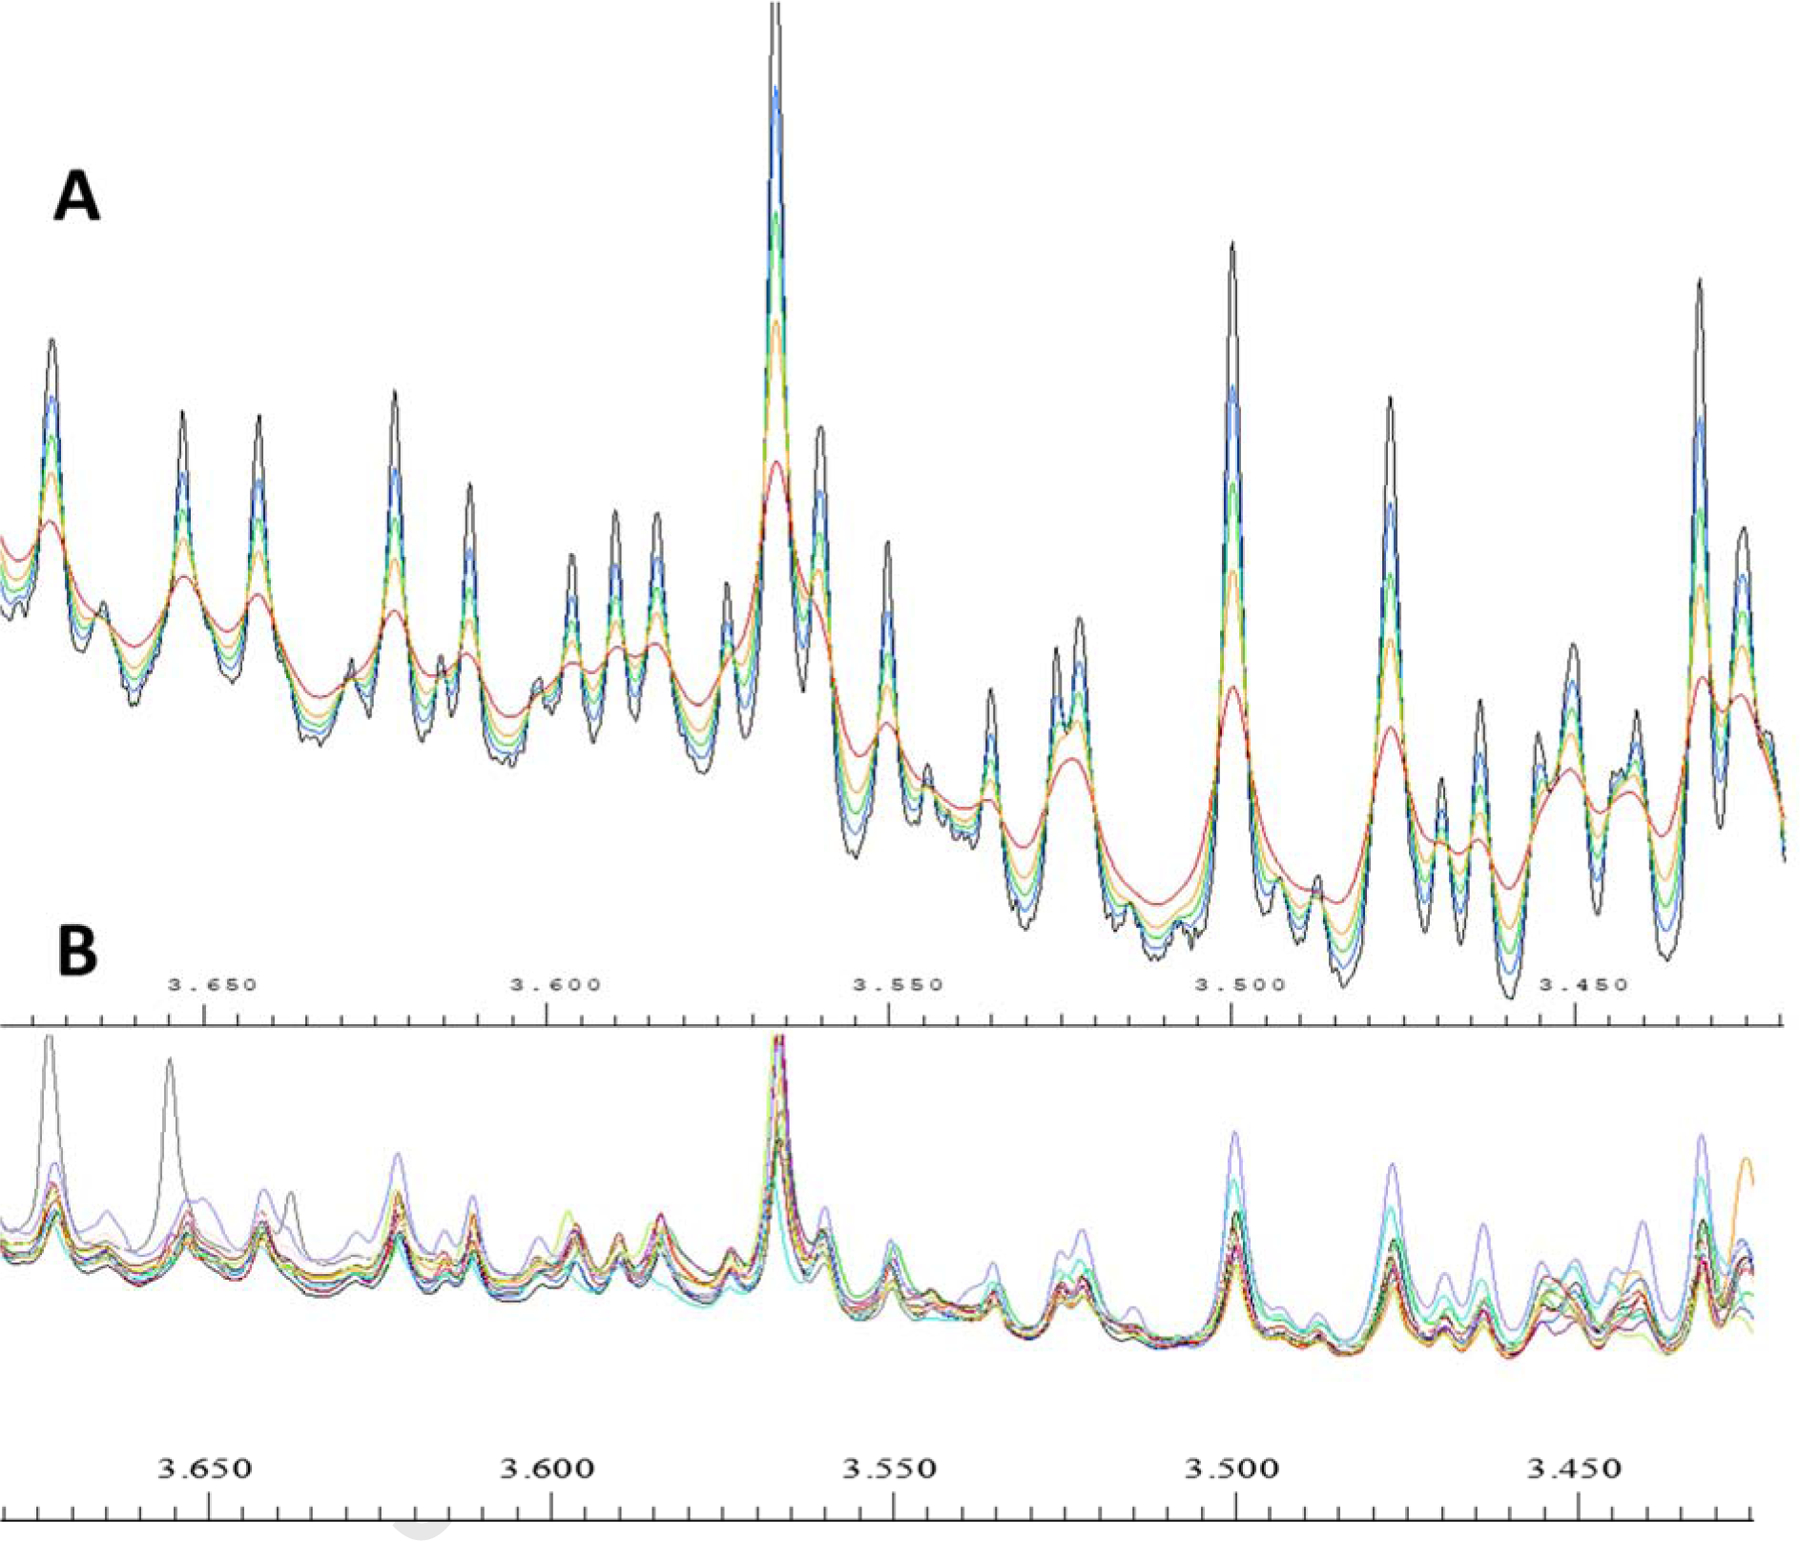
Figure 1.

A, The line broadening factor to the reference peak. The trough order from bottom to top (or crest from top to bottom) is no line broadening, 0.3lb, 0.6lb, 1lb, and 2lb representatively. B, The overlay of all the 12 spectra in the study in the same range of Figure 1A. All the spectra were normalized to the total intensity of the total spectrum range using Amix 4.0.
