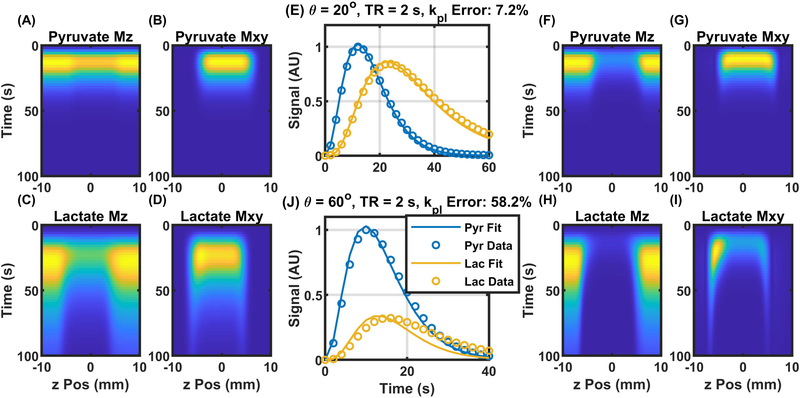
Figure 3.
Magnetization evolution and fitting results for two slice selective sequences. A slight increase in the lactate signal is seen at the edge of the slice profile is apparent in the simulated magnetization evolution for 20° excitation and a 2 second repetition time (Panels A-D). The excess signal results in a minor fitting error using the relative signal evolution(Panel E). Panels F-I show the magnetization evolution for an excitation angle of 60° and the relative signal curves and fit results are shown in panel J where the slice penumbra and slice offset effects are enhanced leading to an even larger fit error.

