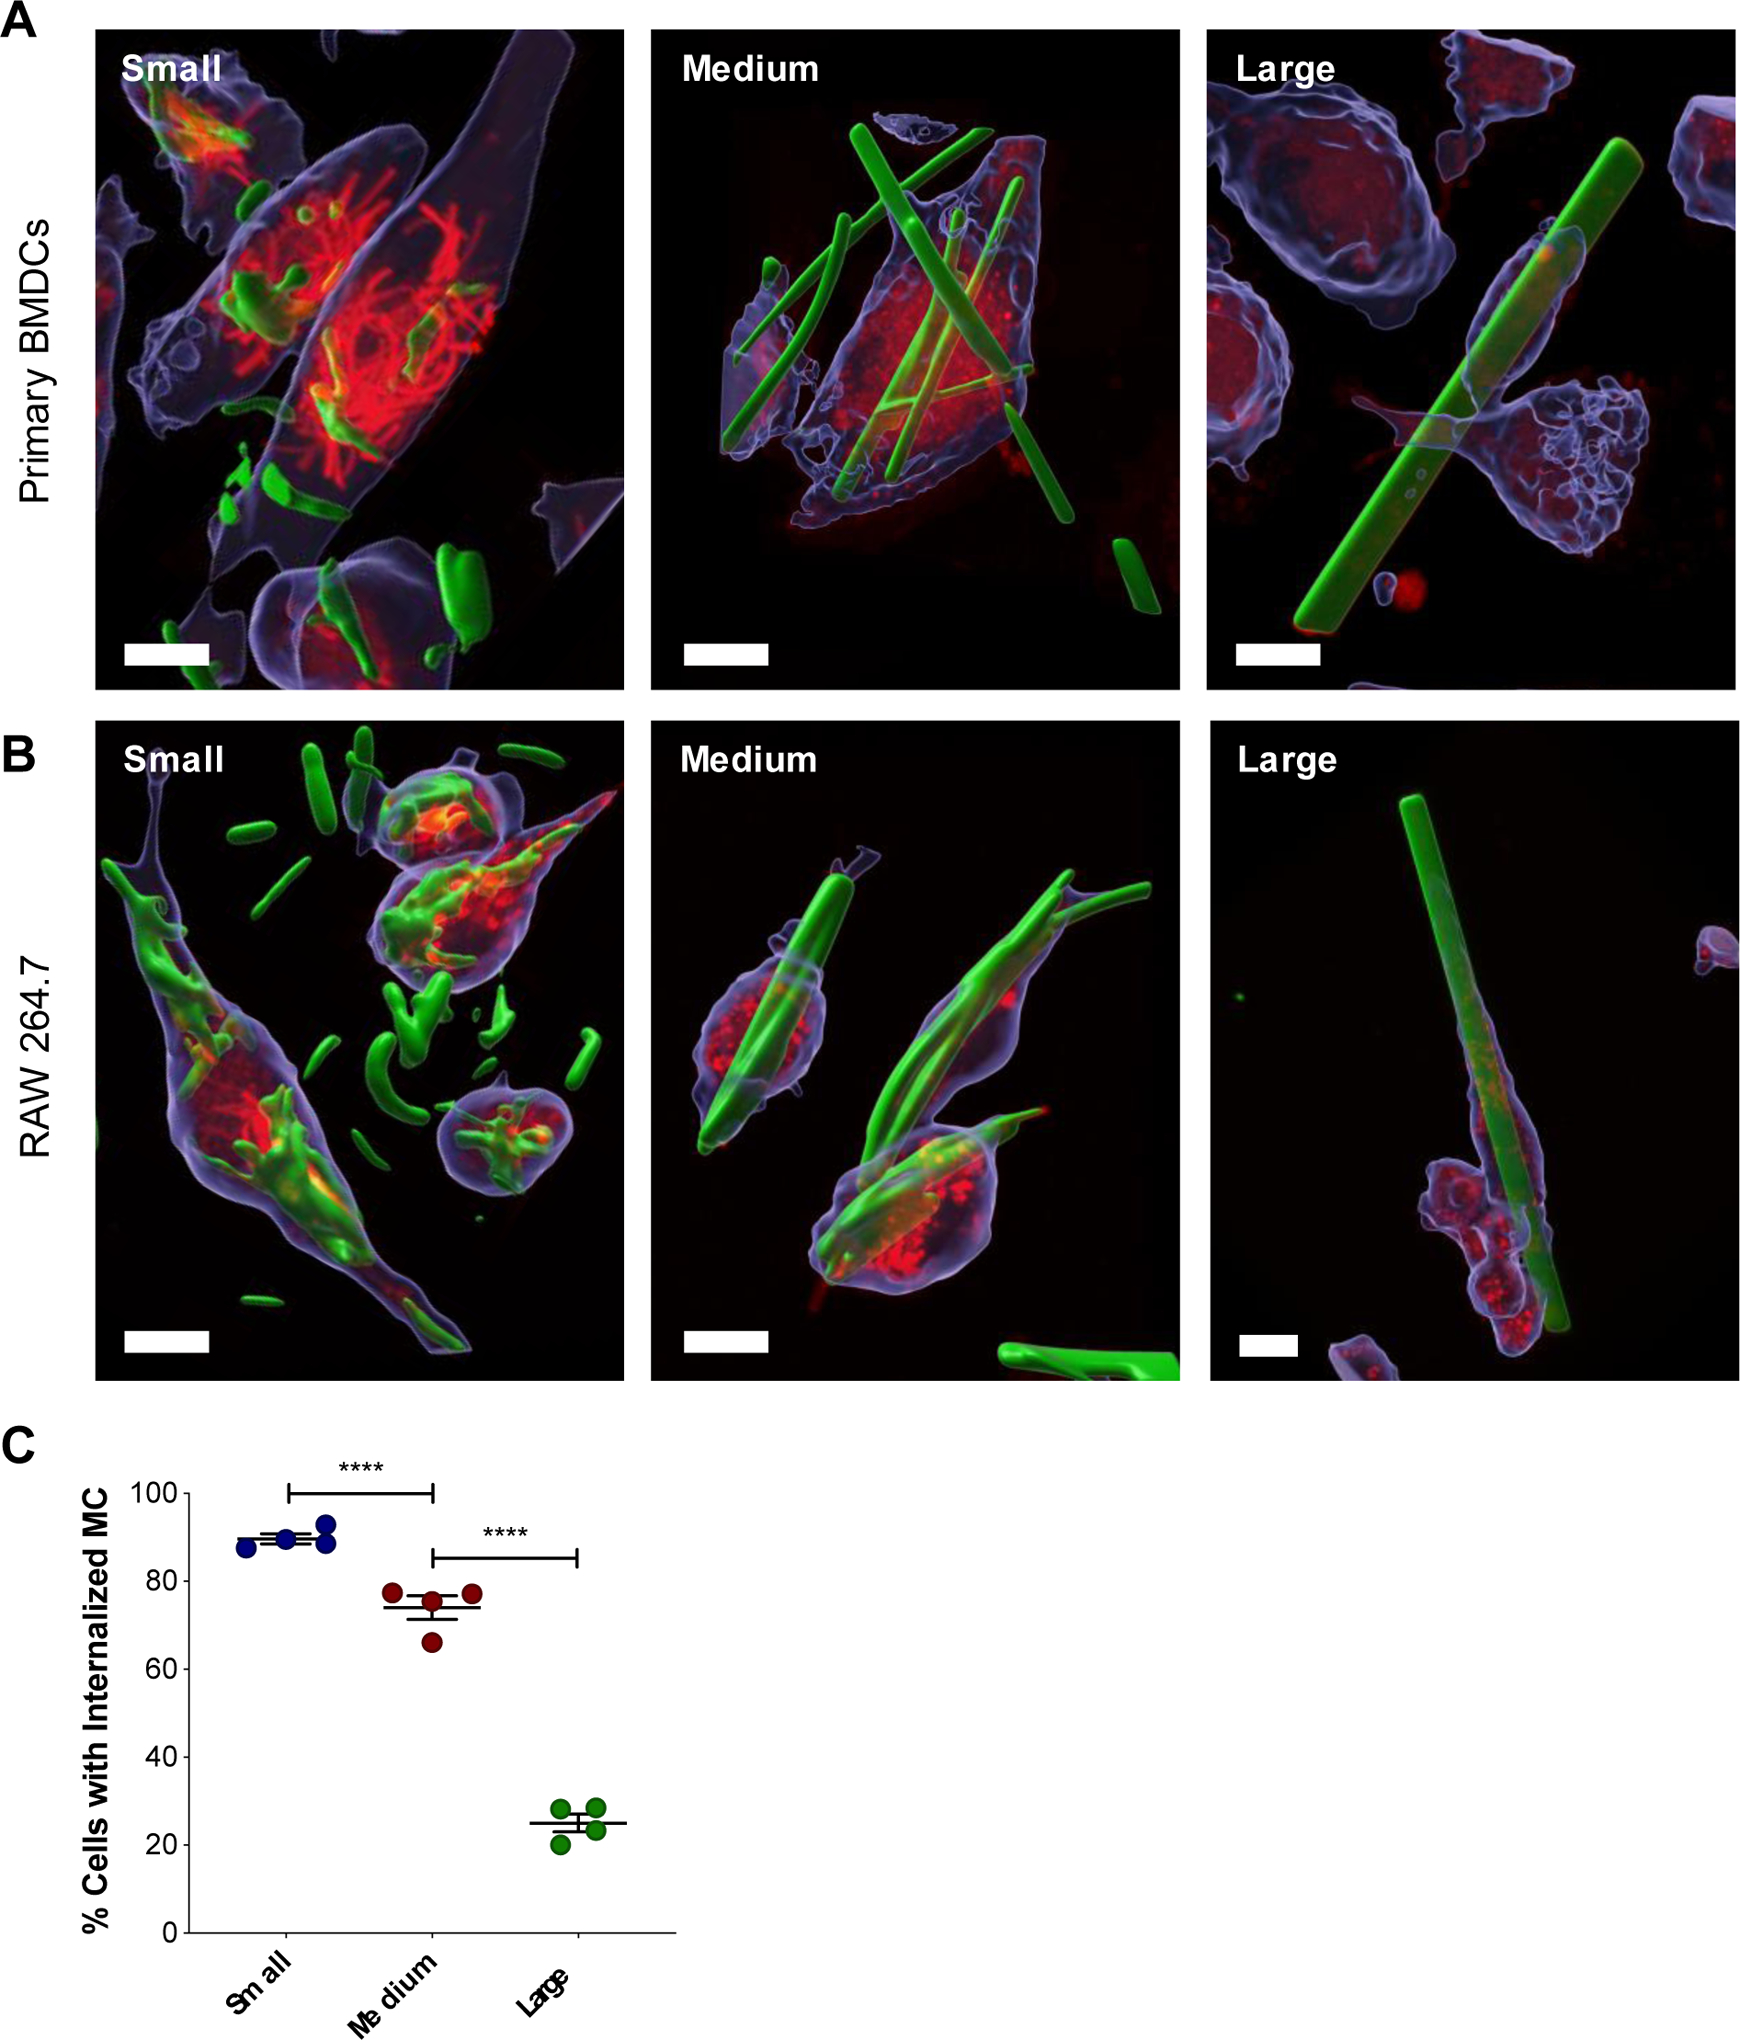
Figure 3.

(A) Confocal microscopy of MC internalization by APCs. Representative 3D renderings of z-stacks created in the Imaris microscopy image analysis software displaying MC internalized within BMDCs (A) and RAW 264.7 cells (B). Cells were treated with BODIPY-MC (green) for 24 hours and then stained with CellTracker (blue) and LysoTracker (red). Scale bar is 10 μm. (C) Quantification of MC internalization after 24 hours verified by z-stack. Percent of cells with one or more internalized MC. Data represented as mean ± standard error of the mean. **p < 0.01, ****p < 0.0001.
