
Figure 3.
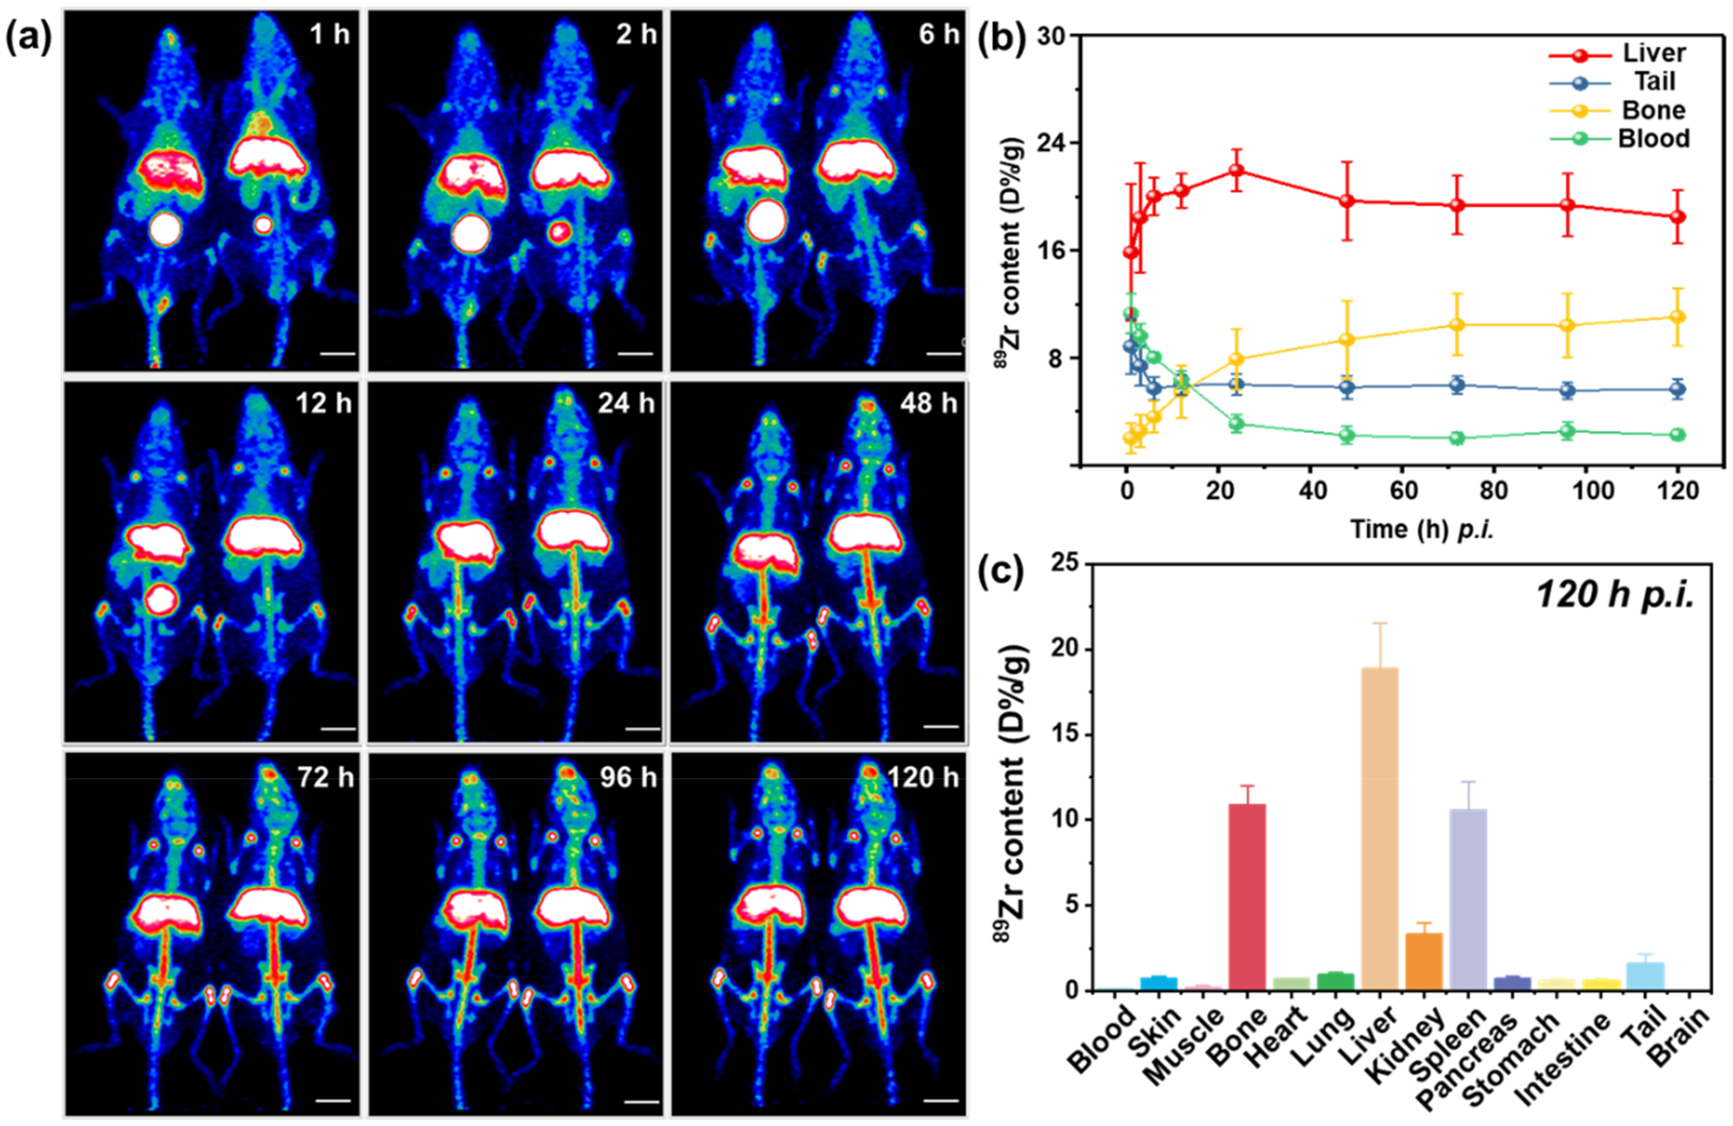
In vivo PET imaging and quantification in organs. (a) Representative maximum intensity projection (MIP) of PET images after i.v. injection of 89Zr–C–NPs at different time points. (b) Quantification of time-activity curve of 89Zr–C–NPs in the liver, tail, bone, and blood at various time points p.i. (c) Quantification of 89Zr–C–NPs in major body areas after 120 h p.i.