
Figure 4.
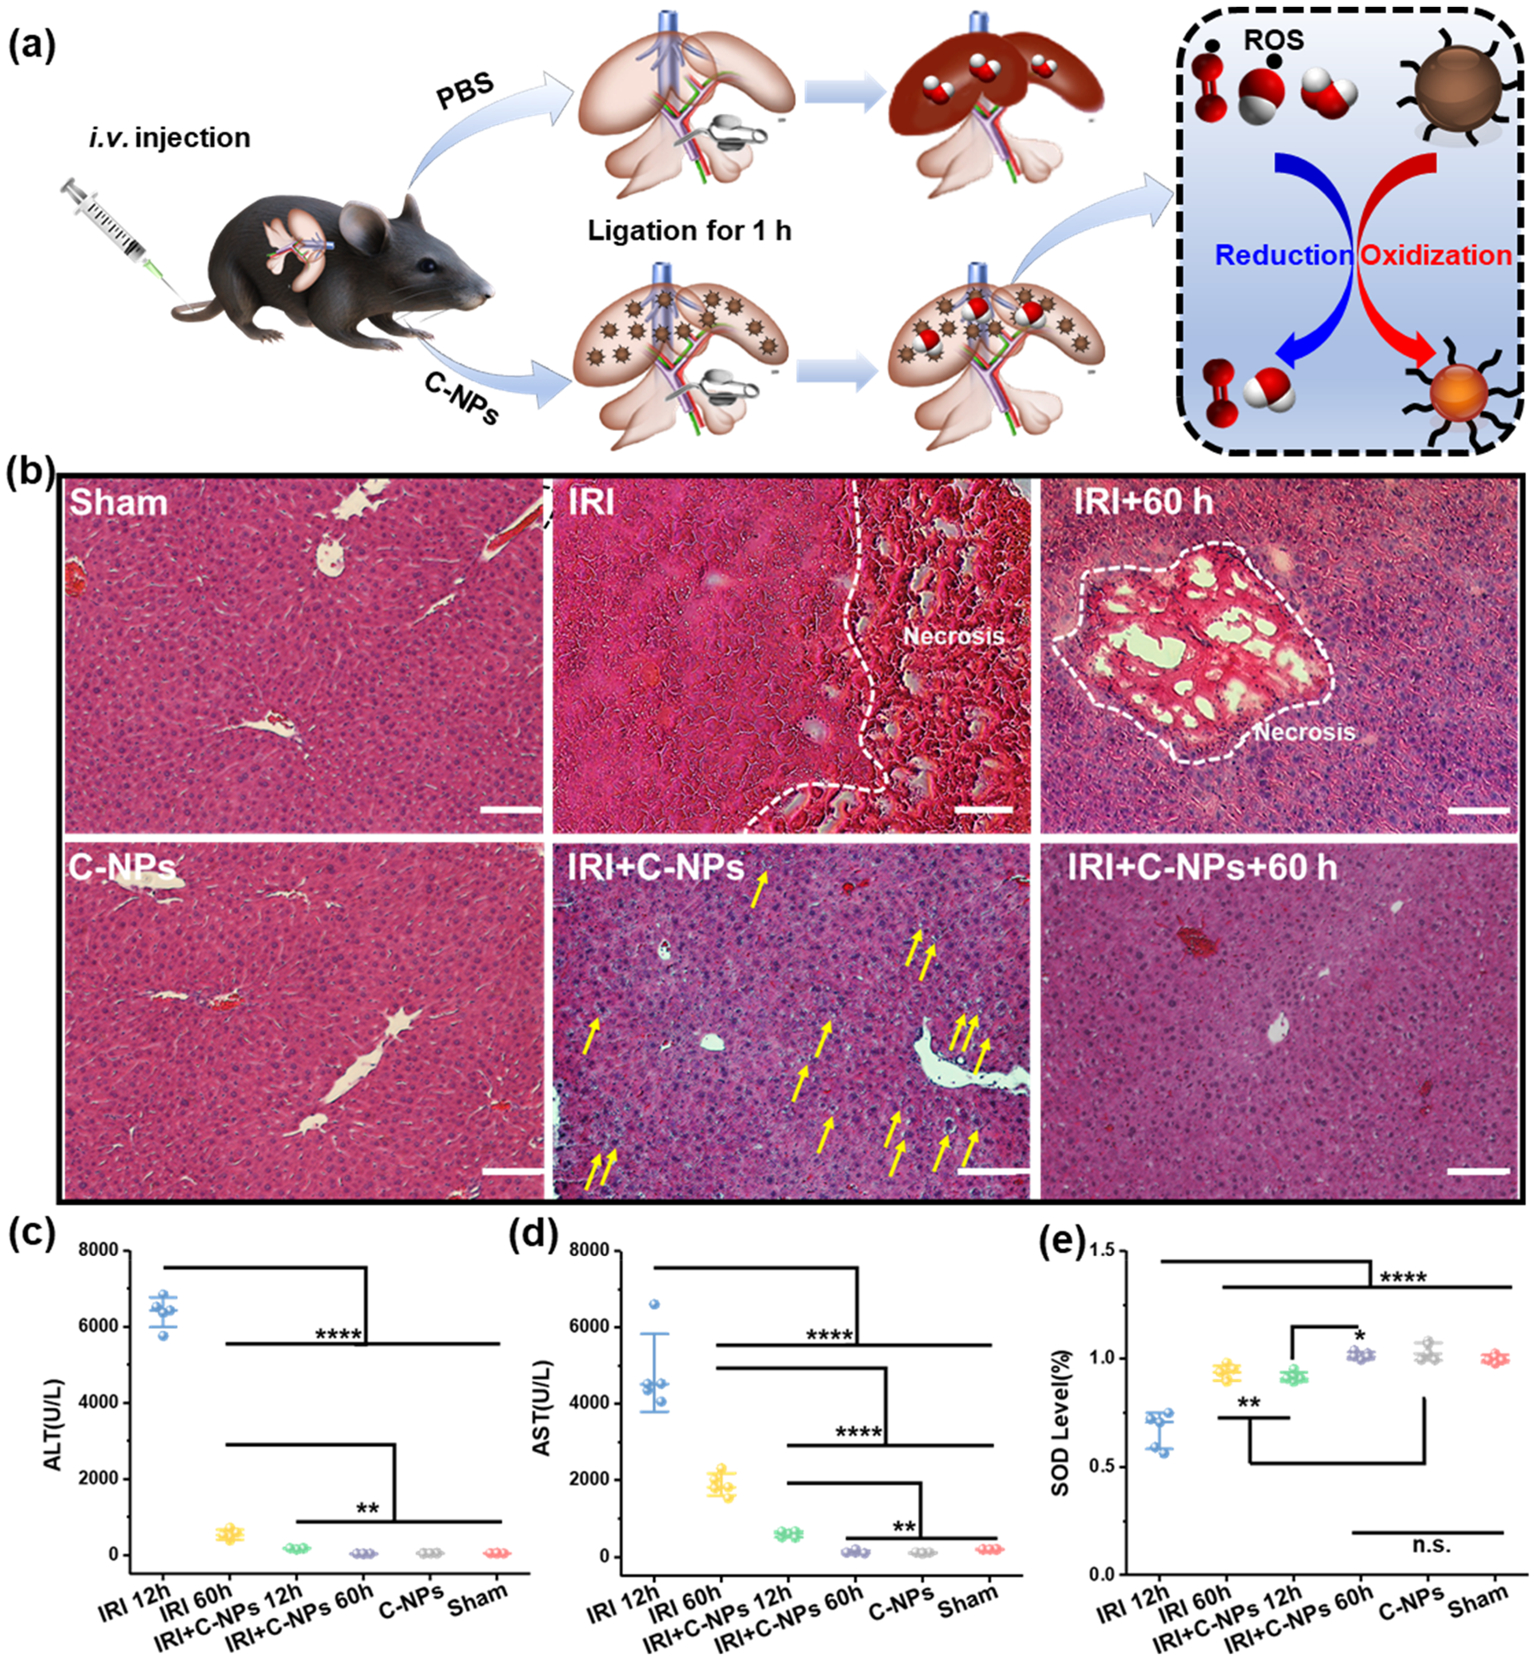
Hepatic IRI prevention performance of C-NPs in mice model. (a) Schematic of the Hepatic IRI generation and treatment. (b) H&E staining of liver tissues from each group. Yellow arrows indicate slight vacuolization, and the white dashed lines show the severe cytolysis, nucleus dissolving, and necrosis of the liver cells. Scale bar: 100 μm. (c) ALT, (d) AST, and (e) SOD levels in liver homogenates from each group. Data represent mean ± s.d. from five independent replicates, and P values were calculated by one-way ANOVA with Tukey’s honest significant difference posthoc test (**** p < 0.0001).