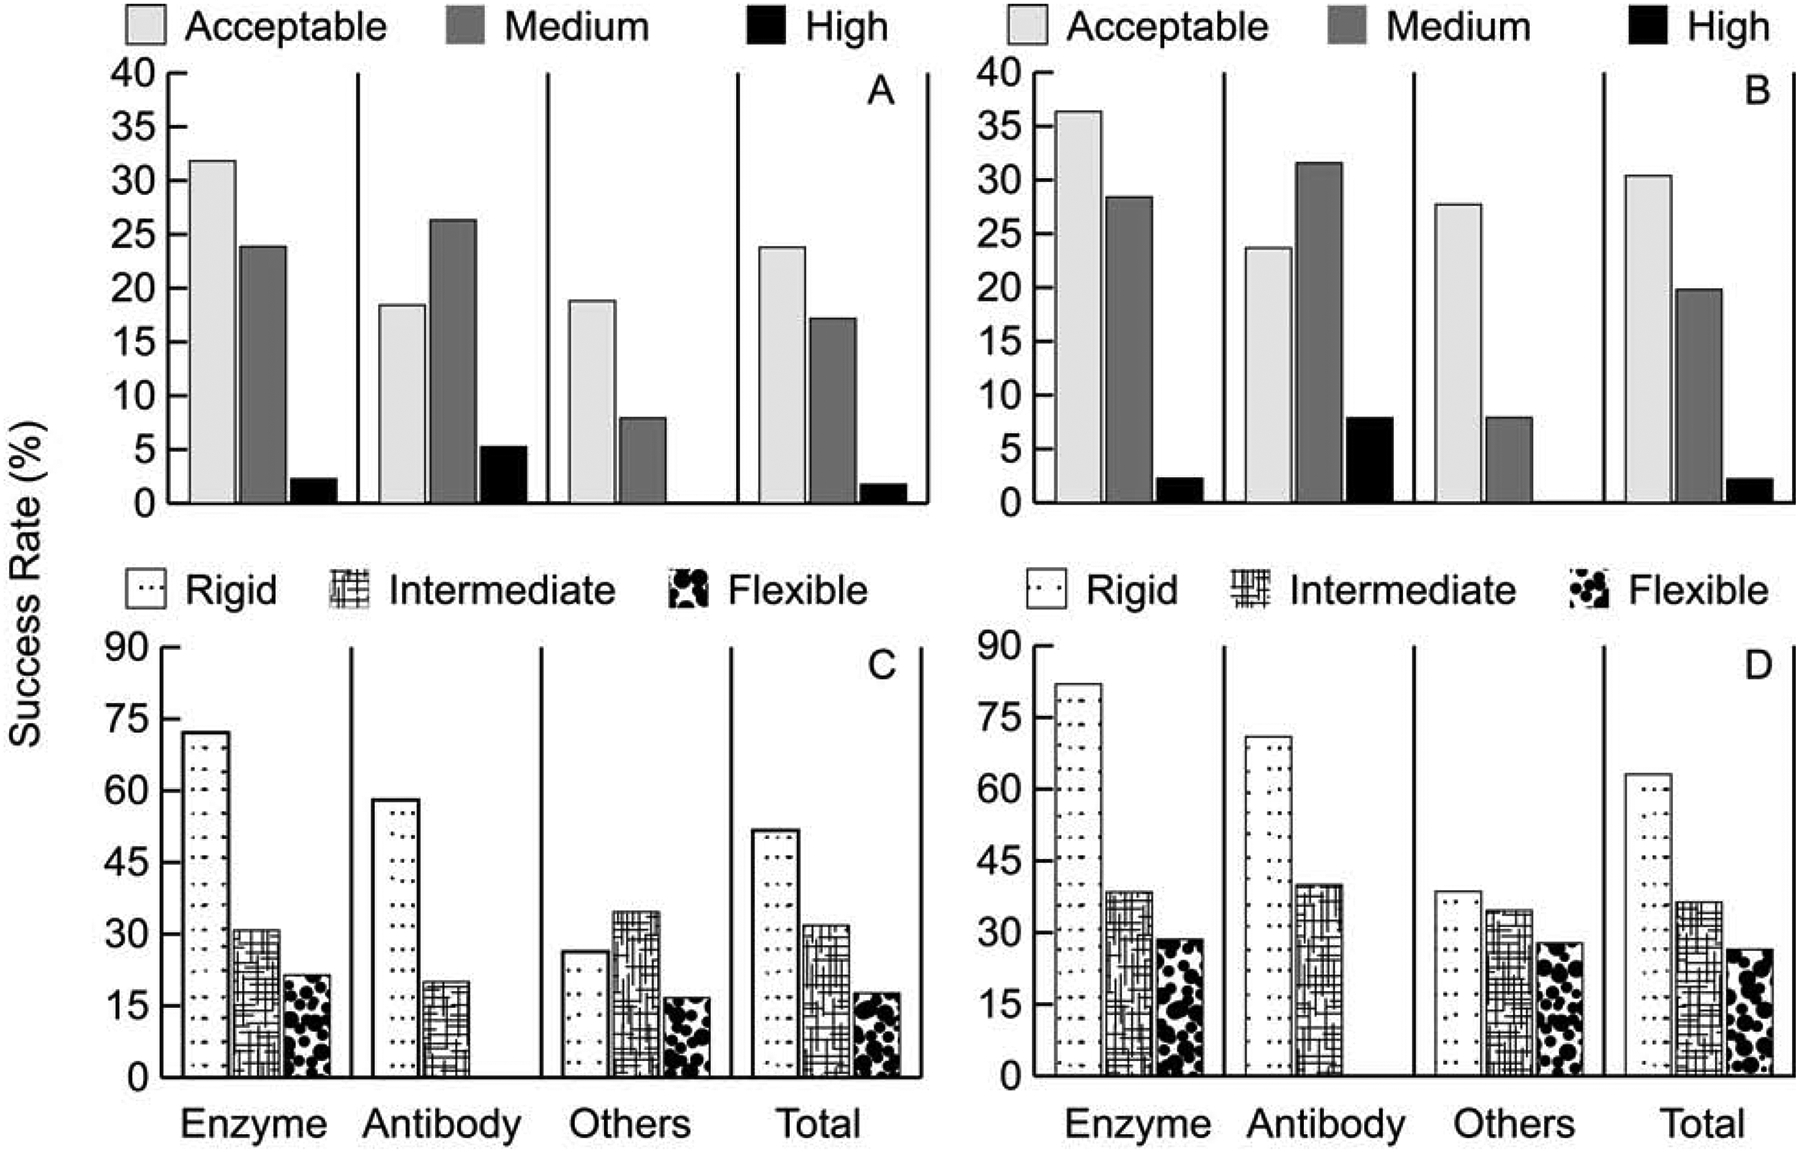
Figure 1.

Performance on the ClusPro server on the protein docking benchmark. A. Percentage of targets with acceptable, medium, and high accuracy models in the top 10 (T10) predictions for different protein types. B. Same as in A, but in the top 30 (T30) predictions. C. Percentage of targets with acceptable, medium, and high accuracy models in the top 10 (T10) predictions, depending on the level of docking difficulty. D. Same as in C, but in the top 30 (T30) predictions.
