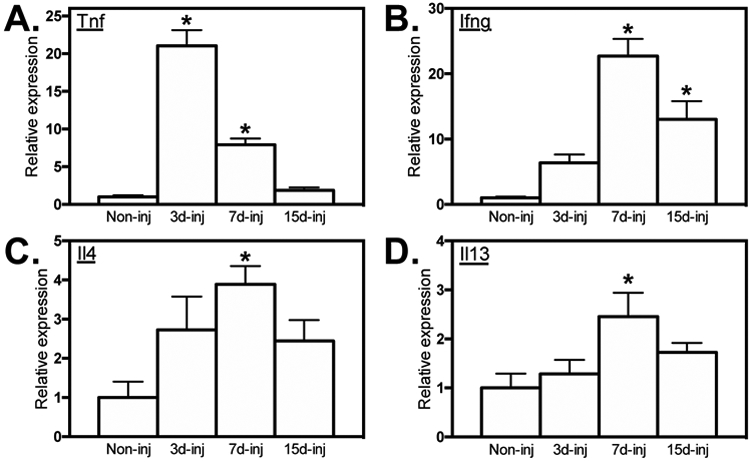
Figure 2.

Elevated cytokine expression in skeletal muscle following acute injury. QPCR analysis showed elevated expression of Tnf, (A), Ifng (B), Il4 (C) and Il13 (D) in the TA muscles 3-, 7- and 15-dpi relative to non-injured muscle. All values were normalized to non-injured WT TA muscle and set at 1. * indicates significant difference (P < 0.05) from non-injured muscle. P-values based ANOVA with Tukey’s multiple comparison test. N = 4-5 for each data set. Data are presented as mean ± SEM.
