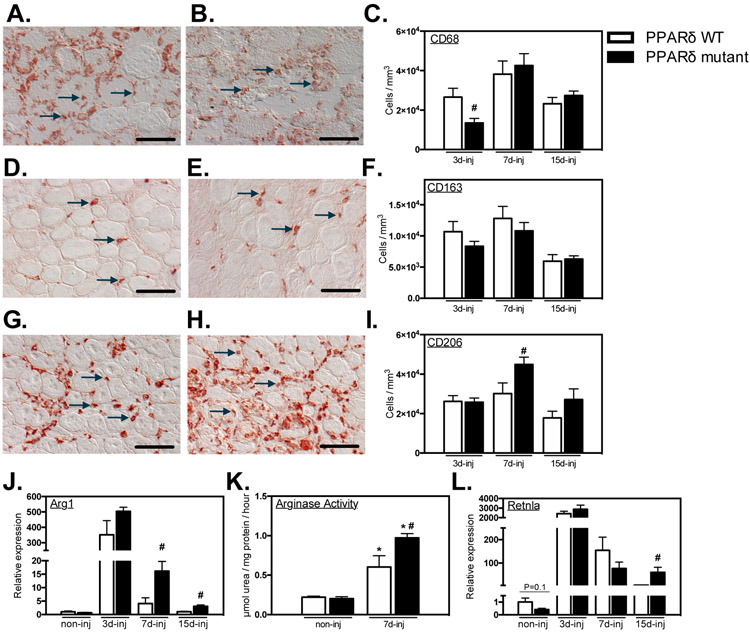
Figure 4.
Ablation of Ppard in myeloid cells shifts macrophages to an M2-biased phenotype in injured muscle. A- I: Representative images and quantification of intramuscular macrophages after injury. Bars = 50 μm. A, B: CD68+ macrophages in PPARδ WT (A) and PPARδ mutant (B) muscles at 3-dpi. Representative CD68+ cells are indicated by arrows. C: Numbers of CD68+ cells per volume of sectioned tissue at 3-, 7- and 15-dpi. D, E: CD163+ macrophages in PPARδ WT (D) and PPARδ mutant (E) muscles at 7-dpi. Representative CD163+ cells are indicated by arrows. F: Quantification of numbers of CD163+ cells per volume of section tissue at 3-, 7- and 15-dpi. G, H: CD206+ macrophages in PPARδ WT (G) and PPARδ mutant (H) muscles at 7-dpi. Representative CD206+ cells are indicated by arrows. I: Numbers of CD206+ cells per volume of sectioned tissue at 3-, 7- and 15-dpi. J: QPCR analysis revealed increased expression of M2-biased transcript Arg1 in muscle of mutant mice after injury. K: Elevated Arg enzymatic activity was detected in Ppard WT and mutant TA muscles 7-dpi compared to non-injured contralateral control muscle. Arg activity was greater in mutant injured TA muscles compared to WT. L: QPCR analysis for expression of the M2-biased transcript Retnla in muscle of mutant mice after injury. All values for QPCR assays were normalized to non-injured Ppard WT TA muscle and set at 1. # indicates significant difference (P < 0.05) from WT within a time point. P-values based on two-tailed t-test. N = 4-6 for each data set. For Arg activity assay, * indicates significant difference (P < 0.05) from non-injured muscle of the same genotype. # indicates significant difference (P < 0.05) from PPARδ WT within a time point. P-values based ANOVA with Tukey’s multiple comparison test. N = 4-5 for each data set. Data are presented as mean ± SEM.

