Figure 5.
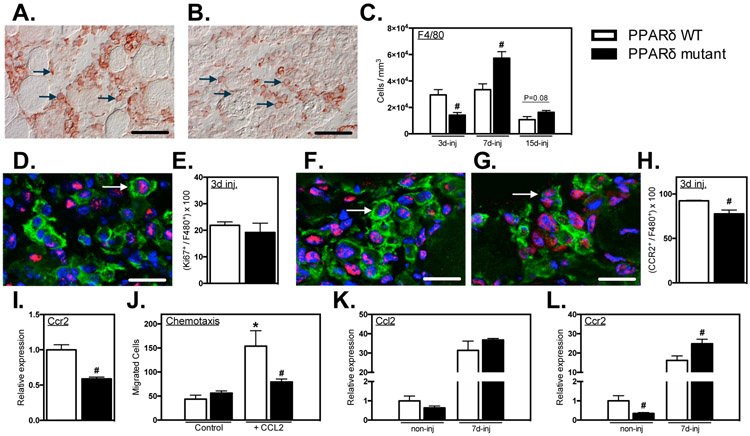
Myeloid PPARδ mutation delayed macrophage accumulation in muscle after injury, regulated CCR2 expression and affected CCL2-mediated chemotaxis. A-C: Cross-sections of TA muscles 3-, 7- and 15-dpi were immunolabeled with anti-F4/80. Representative images of F4/80+ macrophages in PPARδ WT (A) and PPARδ mutant (B) muscles at 3-dpi. Representative F4/80+ cells are indicated by arrows. C: Numbers of F4/80+ cells per volume of sectioned tissue at 3-, 7- and 15-dpi. D: Cross-section of TA muscles 3-dpi from Ppard WT and mutant mice were immunolabeled with anti-F4/80 (green) and anti-Ki67 (red). Nuclei stained blue with DAPI. Arrow indicates an example of an F4/80+ cell with nuclear Ki67. E: Proportion of F4/80+ cells co-expressing nuclear Ki67 in PPARδ WT and PPARδ mutant muscles. F, G: Muscle sections were co-labeled with anti-F4/80 (green) and anti-CCR2 (red). Arrows indicate examples of F4/80+ cells that are CCR2+ at 3-dpi in PPARδ WT and PPARδ mutant muscles. Bars = 10 μm. H: Numbers of F4/80+ cells that were CCR2+ per volume of sectioned tissue at 3-dpi in PPARδ WT (F) and PPARδ mutant (G) muscles. H: Proportion of F4/80+ cells that were CCR2+ at 3-dpi in PPARδ WT and PPARδ mutant muscles. I: QPCR analysis of BMDMs demonstrated that Ppard mutation reduced Ccr2 expression. Values in each data set were normalized to Ppard WT BMDMs and set at 1. # indicates significant difference (P < 0.05) from Ppard WT within a time point. P-values based on two-tailed t-test. N = 4-5 for each data set. J: A chemotaxis assay was used to assess whether PPARδ affects macrophage mobility or chemotaxis. CCL2 increased chemotaxis but the Ppard mutation completely abrogated the chemotactic effect. Macrophage migration was unaffected by PPARδ in the absence of CCL2. * indicates significant difference (P < 0.05) from nontreated BMDMs within same genotype. # indicates significant difference (P < 0.05) from Ppard WT within a treatment group. P-values based ANOVA with Tukey’s multiple comparison test. N = 6 for each data set. Data are presented as mean ± SEM. K, L: QPCR analysis of non-injured or injured muscle at 7-dpi showed that Ppard mutation did not affect Ccl2 expression (K) but decreased Ccr2 expression in non-injured muscle and increased Ccr2 expression at 7-dpi (L). Values in each data set were normalized to Ppard WT BMDMs and set at 1. # indicates significant difference (P < 0.05) from Ppard WT with same treatment conditions. P-values based on two-tailed t-test. N = 5 for each data set.

