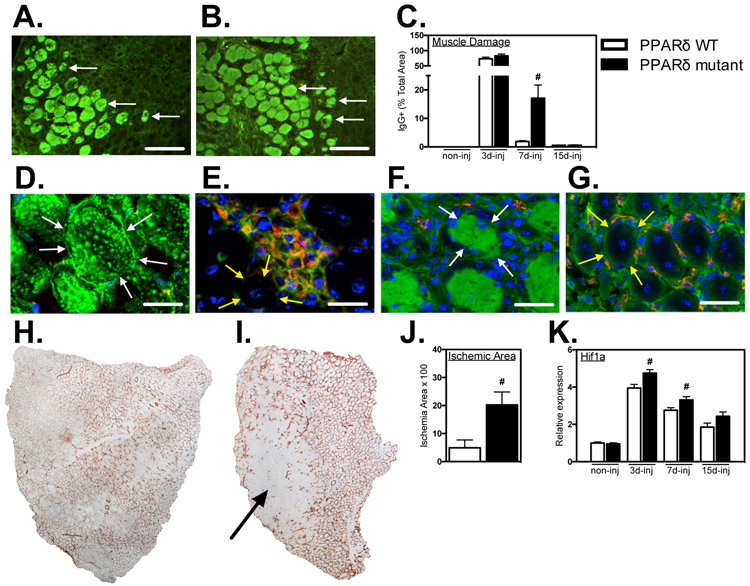
Figure 6.
Myeloid Ppard mutation impairs muscle repair and revascularization following injury. A, B: Representative cross-sections of TA muscles were immunolabeled with anti-mouse IgG (green) to assay for sarcolemma damage at 7-dpi in PPARδ WT and PPARδ mutant muscles. Arrows indicate examples of IgG+ muscle fibers. Bars = 100 μm. C: The volume fractions of TA muscles occupied by IgG+ fibers were quantified at 3-, 7- and 15-dpi. # indicates significant difference (P < 0.05) from WT within a time point. P-values based on two-tailed t-test. N = 4-6 for each data set. D-G: Muscle cross-sections at 7-dpi were co-labeled with anti-mouse IgG (green) and anti-CD68 (red) (D, E) or anti-mouse IgG (green) and anti-CD31 (red) (F, G). Bars = 15 μm. Both CD68+ and CD31+ cells were present in low concentrations in areas marked by muscle fiber damage (D, F) and in high concentrations in areas of regeneration containing centrally-nucleated muscle fibers (E, G). Arrows outline the surface of representative, IgG+, injured fibers (white arrows; D, F) or IgG-, central-nucleated, regenerative fibers (yellow arrows; E, G). H, I: Representative images of whole TA muscle cross-sections immunolabeled for CD31 in Ppard WT (H) and mutants (I) at 7-dpi. Arrow indicates ischemic region of muscle sparsely populated by CD31+ cells. J: Quantification of the volume fraction of the muscle sparsely occupied by CD31+ cells at 7-dpi. # indicates significant difference (P < 0.05) from Ppard WT. P-values based on two-tailed t-test. N = 5 for each data set. K: QPCR assays showed elevated expression of the hypoxia inducible transcript Hif1a in mutant muscle 3- and 7-dpi compared to WT. Values were normalized to non-injured Ppard WT TA muscle and set at 1. # indicates significant difference (P < 0.05) from Ppard WT within a time point. P-values based on two-tailed t-test. N = 4-6 for each data set. Data are presented as mean ± SEM.

