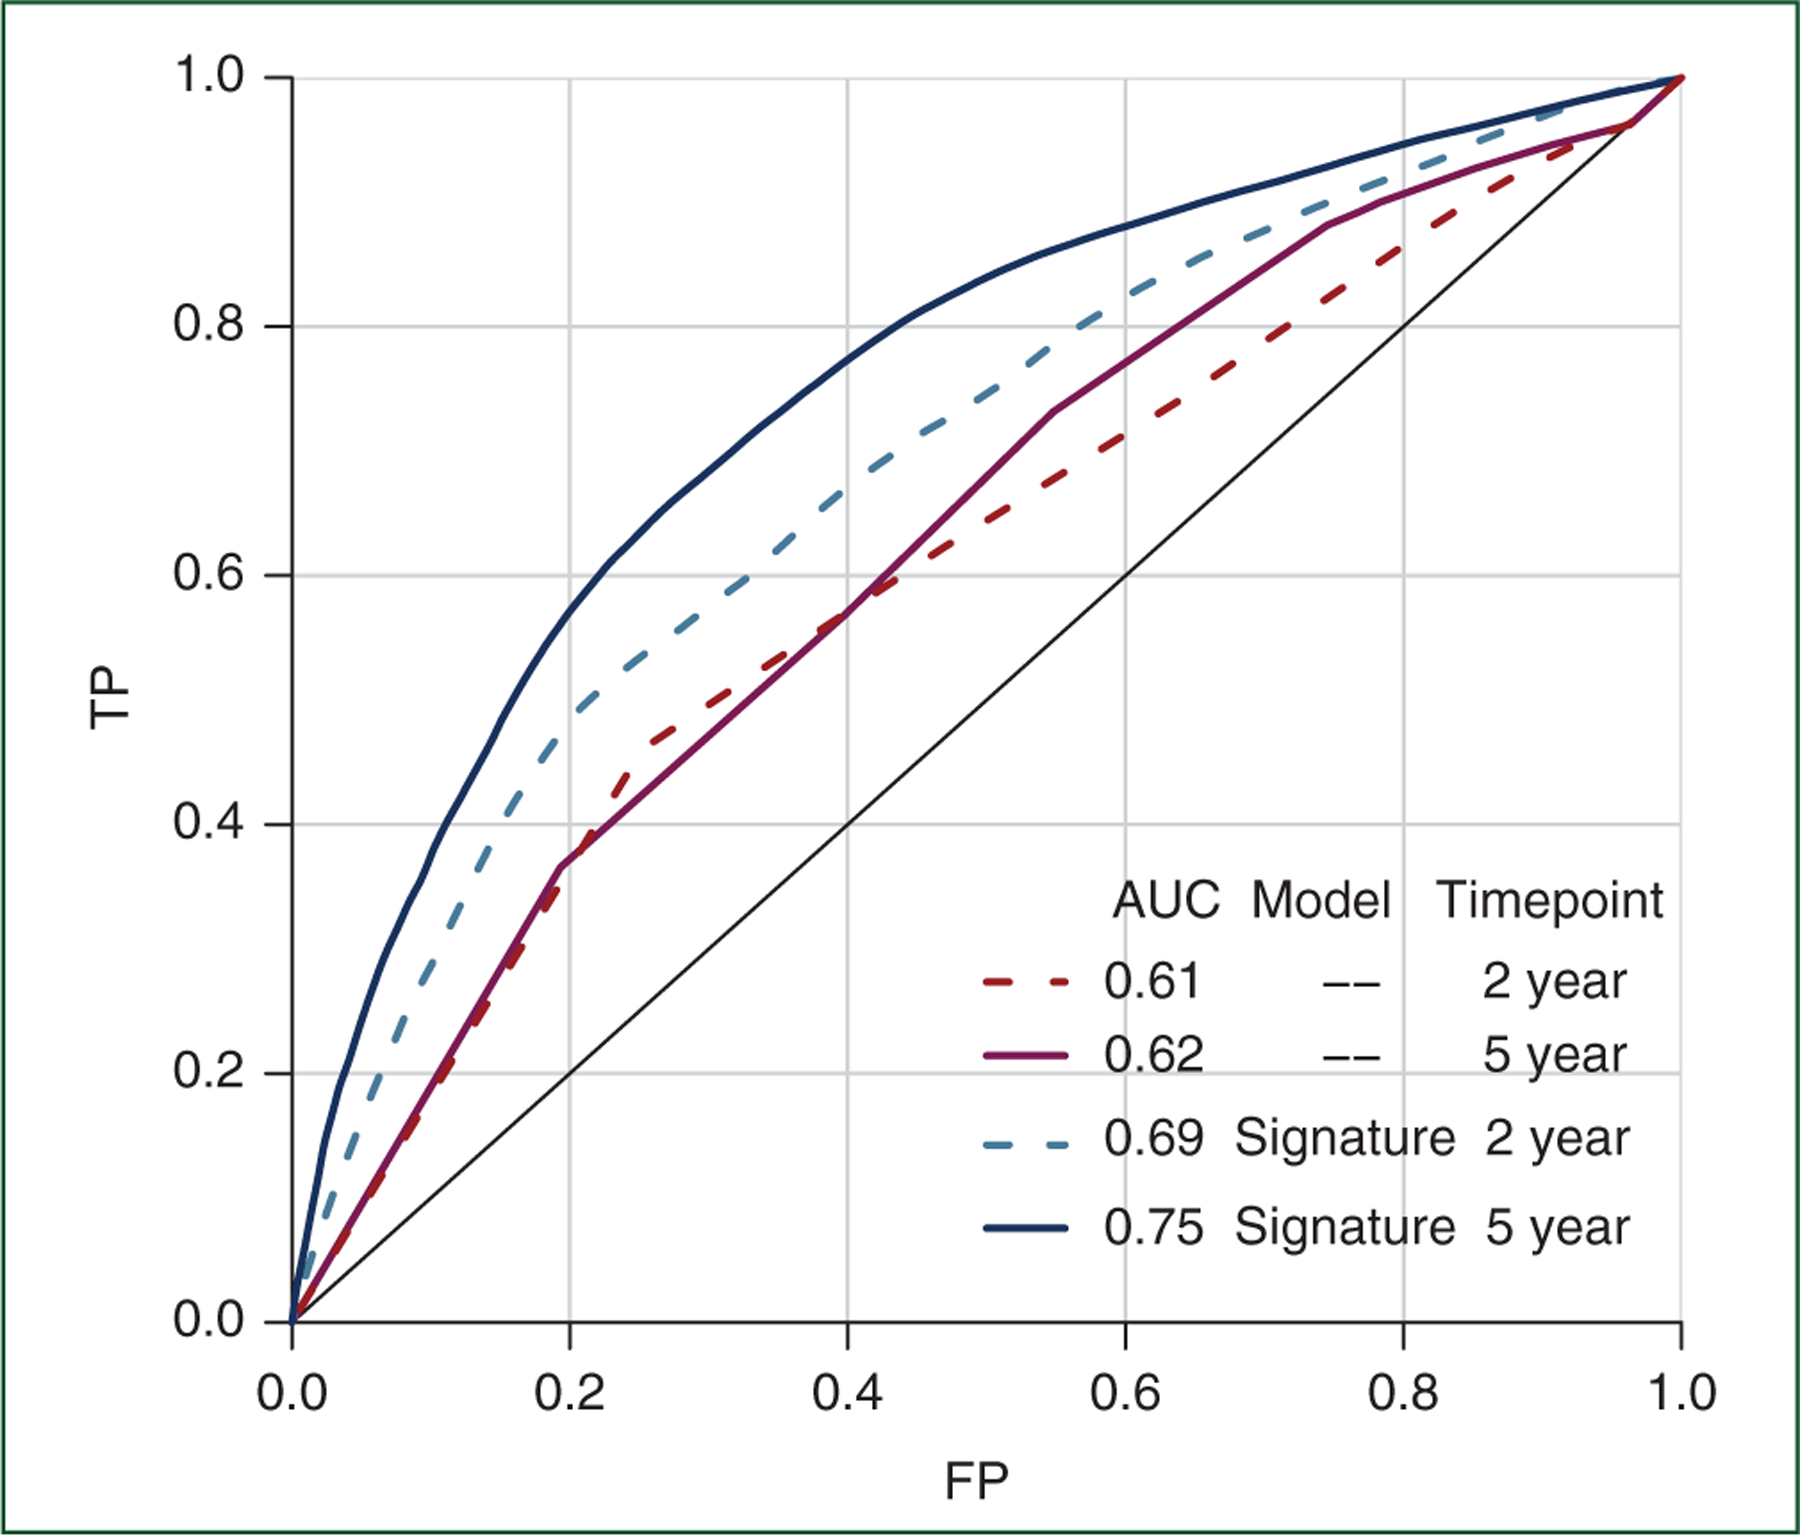
Figure 2. Receiver operator characteristic (ROC) curves for prognostic performance of the gene expression signature in independent high-grade serous ovarian cancer patients (testing data).

There was no overlap between studies or patient data used to develop models (training data) and construct ROC curves and calculate area under the curve (AUC) values shown here (testing data). All models included age and stage as described in Methods section. TP denotes the true positive rate (sensitivity) and FP denotes the false positive rate (1 − specificity).
