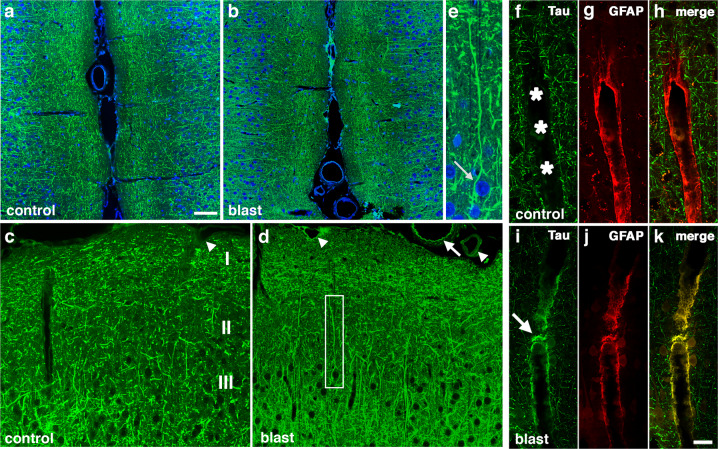
Fig. 2. Immunostaining and distribution of p-tau in blast-exposed rat brain.
a–e increased and somatodendritic redistribution of p-tau in the anterior cingulate cortex and motor cortex of blast-exposed rats 6 weeks following blast exposure. Shown are sections of the anterior cingulate a–e of control a, c and blast-exposed rats b, d, e immunostained with AT270 (green) counterstained with DAPI (blue). Cortical layers are indicated in panel c. Note the general increase of p-tau in all cortical layers in the blast-exposed animals b, d. e Higher power image of the neuron outlined by the white box in panel d showing prominent somatodendritic localization of p-tau. f–k perivascular p-tau in astroglial processes 10 months after blast-exposure. Penetrating cortical vessels from control f–h and blast-exposed rats i–k AT270 (green, f and i) and GFAP (red, g and j). The arrow in panel i indicates p-tau staining. An arrow in panel d indicates p-tau staining that appears to be in an elastic membrane. Arrowheads in panel d indicate other examples of perivascular tau staining. A penetrating cortical vessel that was not stained is indicated by an arrowhead in panel c. Scale bar: 50 μm a, b, 25 μm c, d, 10 μm e. Scale bar for panels f–k: 20 μm.

