
Figure 1: Molecular indicators of the pluripotent ground state vary in diverse mESCs.
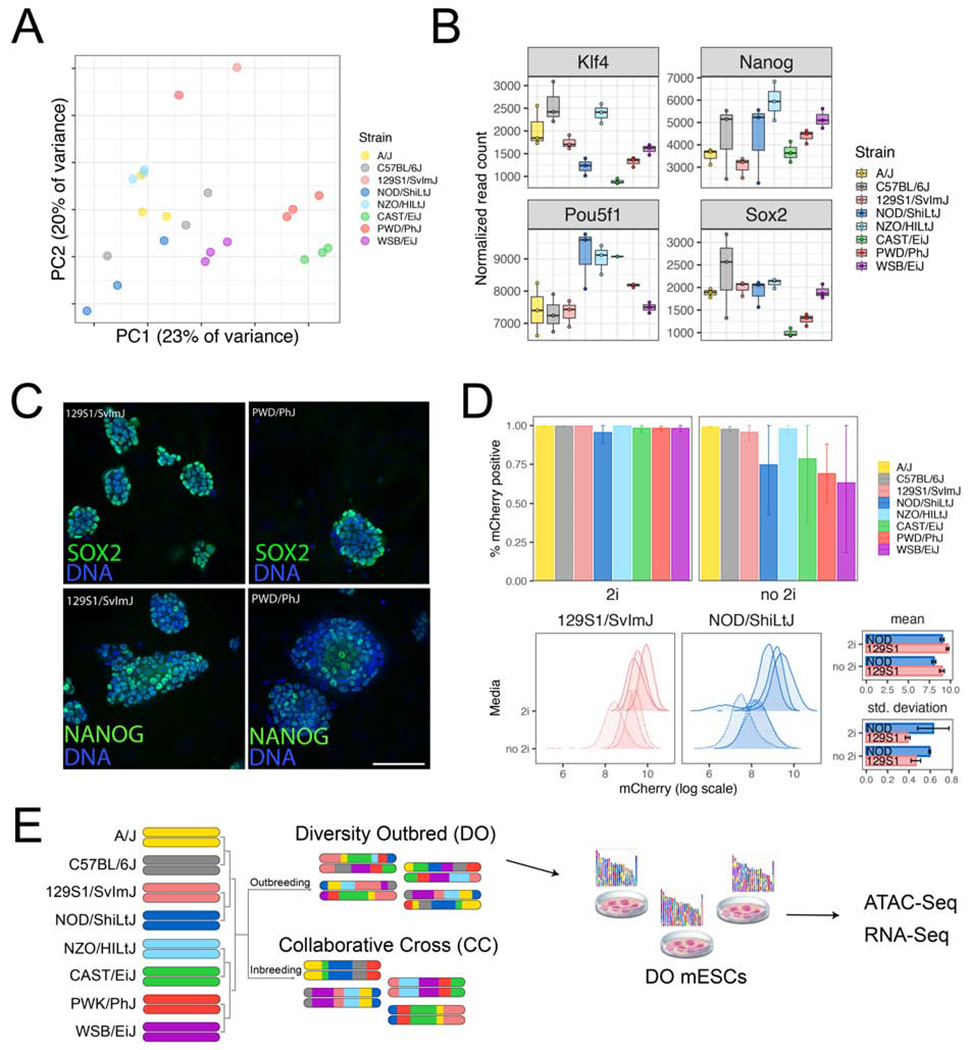
(A) Principal component analysis (PCA) of gene expression for mESCs from eight diverse backgrounds. Dots of the same color represent biological replicates derived from the same strain. (B) Expression of core pluripotency genes and early lineage markers shows both intrastrain (e.g. B6) and interstrain (e.g. NOD vs. WSB) variability. Points show normalized read counts for each biological replicate, with first quartile, median, and third quartile (boxes) and minimum/maximum (whiskers). (C, D) Quantification of NANOG expression using immunofluorescence and a Nanog-mCherry reporter knock-in. (C) Representative composite images of two mESC lines showing variable NANOG and SOX2 expression in 2i culture conditions. Scale bar = 50μm. (D) Nanog-mCherry expression in the presence and absence of 2i. Top bar graphs show percentage of mCherry positive cells in the two media conditions (mean ± standard error). Bottom histograms show the full distribution of mCherry fluorescence for strains 129S1 and NOD. Bar plots at right quantify distributions shown on left. (E) Overview of experimental design. See also Figure S1.