
Figure 2: Genetic variation drives local and distant regulation of chromatin accessibility and gene expression.
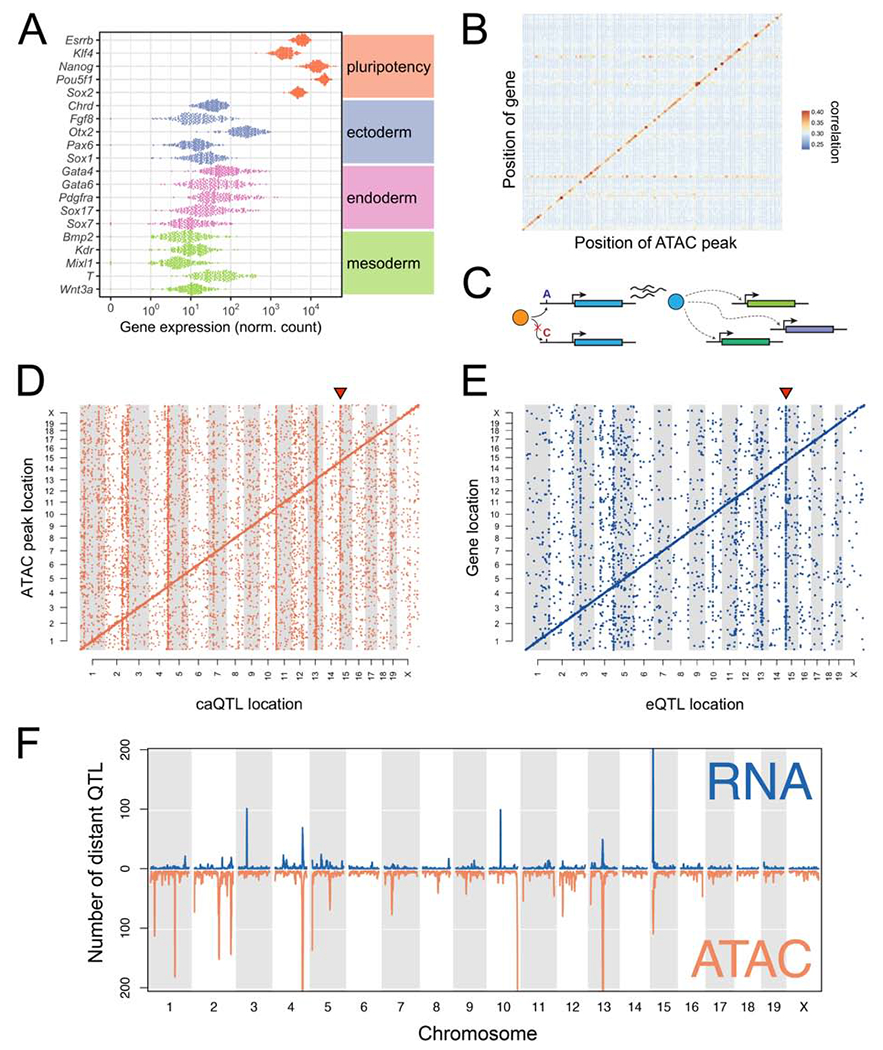
(A) Expression of core pluripotency genes and early lineage markers. Dots represent gene expression values for individual DO mESC lines. (B) Correlations between gene expression and chromatin accessibility across the genome. Only autosomal genes with a local eQTL (LOD >7.5) are shown. Genes/open chromatin regions were grouped in 20Mb bins. Correlations between all transcripts and accessibility of all chromatin regions in the bin were computed, and the maximum correlation retained for each transcript. Points are colored and sized according to the mean magnitude of correlation (i.e. average maximum transcript-to-peak correlation across the bin). (C) Schematic of an idealized eQTL hotspot. Transcript abundance of the blue gene is influenced by an upstream polymorphism (A/C) that alters binding of a transcription factor (orange). Protein (blue) directly or indirectly regulates the expression of other genes in trans (dotted lines with arrowhead). (D) Genomic locations of significant caQTL. Diagonal bands reflect the predominance of local caQTL. Triangle above caQTL shows an exemplary hotspot on Chr 15. (E) Genomic locations of significant eQTL. Diagonal bands and triangle above Chr 15 hotspot are as in (D). (F) Distinct and co-occuring caQTL and eQTL hotspots. See also Figure S2.