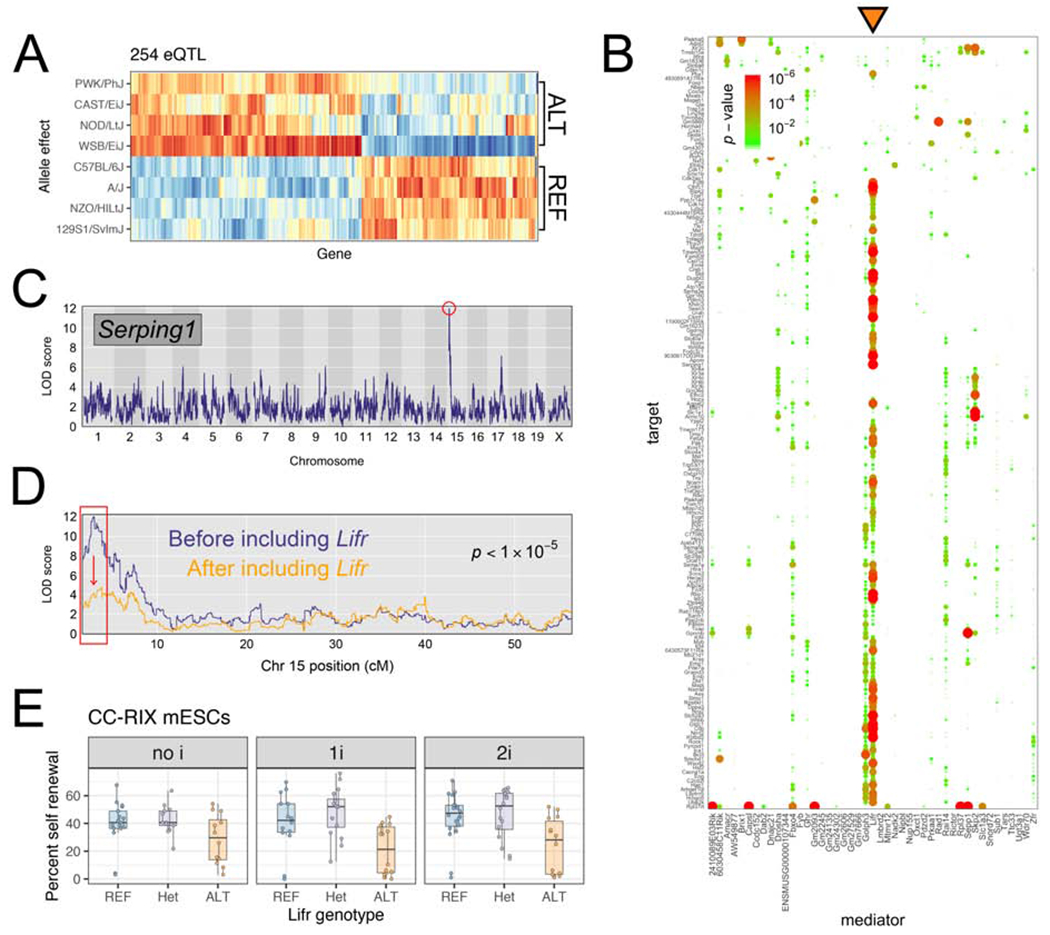
Figure 3: QTL mapping to chromosome 15 implicates the cytokine receptor Lifr as a key gene regulating chromatin and gene expression at genomically distant loci.

(A) Allelic effects for targets of the Chr 15 hotspot. Red/orange indicate higher expression of the target gene in mESCs carrying a haplotype derived from the founder listed at left. Blue/light blue) indicate the opposite. For each target gene, effects are scaled to have mean 0 and variance 1. (B) Mediation analysis reveals that Lifr is the best mediator (orange triangle) for hotspot targets. Dotplot shows candidate mediators located within Chr 15 hotspot along x-axis, and targets of the hotspot on y-axis. Change in LOD score is shown by points sized and colored proportional to the FDR-adjusted p-value as shown in the legend at top left. (C, D) Serping1 provides an example of a gene with expression mediated by Lifrexpression. (C) Serping1 is located on Chr 2 (~84Mb) and has a strong distant eQTL (LOD = 12) on Chr 15. (D) The LOD significance score for the Chr 15 QTL drops >6 LOD units (p-value is shown) when Lifr expression is included as a covariate in the genetic mapping model. (E) CC-RIX mESC self-renewal percentage measured in three media conditions shown in facets. Replicate measurements within each panel are connected by a line. Boxes show first quartile, median, and third quartile, while whiskers extend to a maximum of 1.5 times the inter-quartile range. See also Figure S3.
