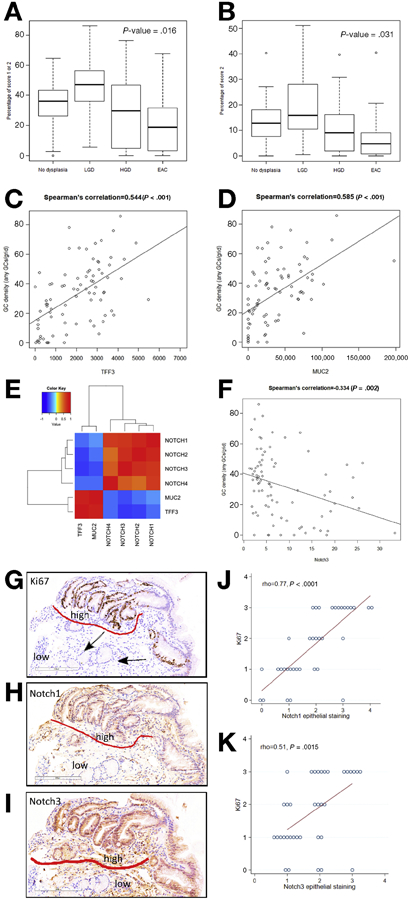
Figure 1.

There was a significant decrease in GC density from non-dysplastic regions of BE epithelium with neoplastic progression in patients without dysplasia, low grade dysplasia (LGD), high grade dysplasia (HGD), and adenocarcinoma (EAC), measured for each subject as proportion of evaluable grids with any GCs (A) and proportion of evaluable grids with >3 GCs (B). Expression of TFF3 (C) and MUC2 (D) were also correlated with GC density Correlogram of the expression of TFF3 and MUC2 and NOTCH1-4 (E). Significant inverse correlation between NOTCH3 and GC density (F). Representative IHC images (G-I) demonstrating that glands with high Notch1 and Notch3 expression on IHC contained few GCs and also showed high levels of proliferation (e.g. for Ki67, “high” and “low” refer to regions of high and low expression, respectively, GCs are labeled with an arrow). IHC analyses demonstrated significant correlation between Notch1 and Notch3 with Ki67 (J, K).
