Figure 2.

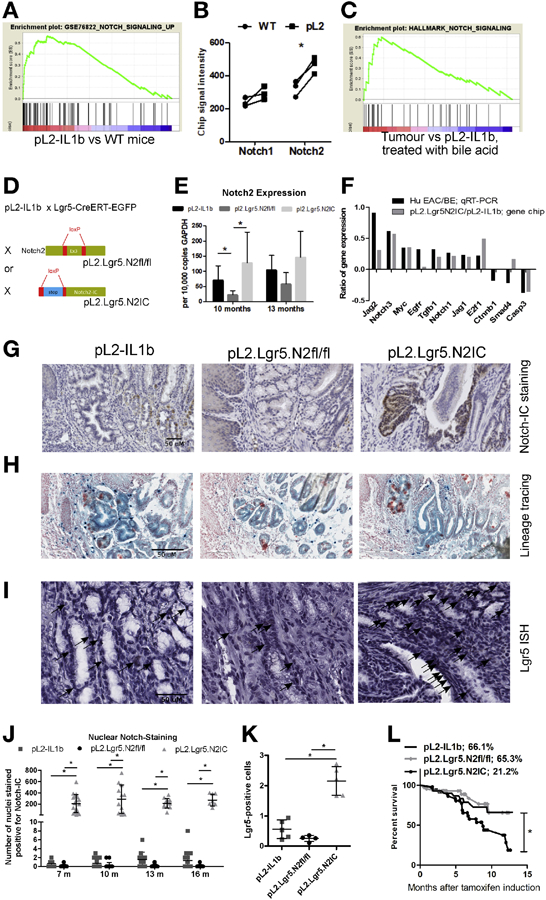
A BE mouse model with engineered Notch2IC expression in gastric Lgr5+ stem cells lead to dysplasia, increased Notch-IC staining and decreased survival rates. (A) GSEA comparing L2-IL1B versus WT mice with a set of Notch dependent genes. (B) single gene expression analysis of Notch1 and Notch2. (C) GSEA of a Notch signature comparing tumor bearing mice and L2-IL1B mice that were previously treated with bile acid. (D) Generating mouse models with the conditional knockout of Notch2 and overexpression of activated Notch2-IC in Lgr5+ cells on top of the inflammatory background of L2-IL1B mice. (E) qRT-PCR validates Notch2 expression levels in genetically modified L2-IL1B mice. (F) differential gene expression pattern of human donors (HGD/EAC vs. non-dysplastic BE) and our mouse models (mice overexpressing IL1B and NOTCH2 in Lgr5 cells vs. mice only overexpressing IL1B). (G) IHC staining of Notch-IC. Shown are representative examples at 13 months after induction. (H) Lineage tracing experiments of our mouse strains that were crossed to Rosa26-LacZ mice indicating the presence of Lgr5 expressing progenitor cells in dysplastic tissue. (I) In situ hybridization (ISH) for Lgr5 depicting Lgr5+ progenitor cells at the SCJ in areas of BE. (J) Intranuclear Notch-IC reactivity in the three mouse strains at indicated time points as positive cells in the BE region in 10 high-power fields. (K) Statistical quantification of Lgr5+ cells per 10 high -power fields as shown as representative images in (I). (L) Kaplan-Meier curves showing decreased survival of pL2.Lgr5.N2IC mice compared to the other two strains. Data is presented as means ± standard deviation. Statistical analysis were performed using one-way ANOVA and Tukey’s multiple comparison test; *p<.05.
