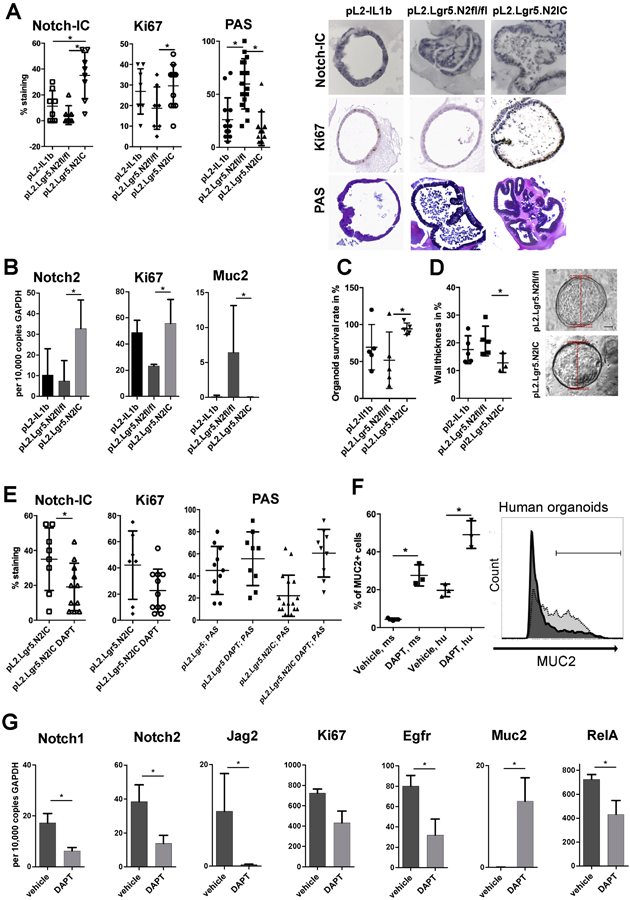
Figure 5.

Notch activity in progenitor cells determines cell fate and growth rates of ex vivo cultured organoids. (A) IHC results of 3D cultured organoids. Organoids were isolated from indicated mouse strains and analysed for Notch-IC, Ki67 and PAS reactivity with representative images at passages 3-5 after isolation. (B) Differential gene expression of organoid cells was performed via qRT-PCR. (C) Organoid survival rates and (D) organoid wall thickness (relative to the organoid diameter) that serves an indicator of goblet-like maturation. Representative examples are displayed (right). (E-G) pL2.Lgr5.N2IC or pL2.Lgr5 mice derived organoids were treated with the gamma-secretase inhibitor of Notch signaling, DAPT (50μM). (E) Summarized IHC results of 3D cultured organoids. (F) Flow cytometry of singularized organoid cells derived from mouse (ms; L2-IL1B) and human (hu, BE) samples. The representative histogram indicates the range of Muc2+ cells for vehicle (dark, 19.4%) and inhibitor (50μM; light grey, 56.8%) treated conditions quantified via flow cytometry after enzymatic cell separation of organoids 3D culture. Data is presented as means ± standard deviation of at least three independent experiments. Statistical analysis was performed using Student's T-Test, *p<.05 (G) qRT-PCR of pL2.Lgr5.N2IC derived organoids. At least three independent experiments were performed; Data are presented as mean standard deviation. (A-E, G) Data is presented as means ± standard deviation. Statistical analysis was performed using one-way ANOVA and Tukey’s multiple comparison test or student t-test. *p<.05.
