
Figure 6.
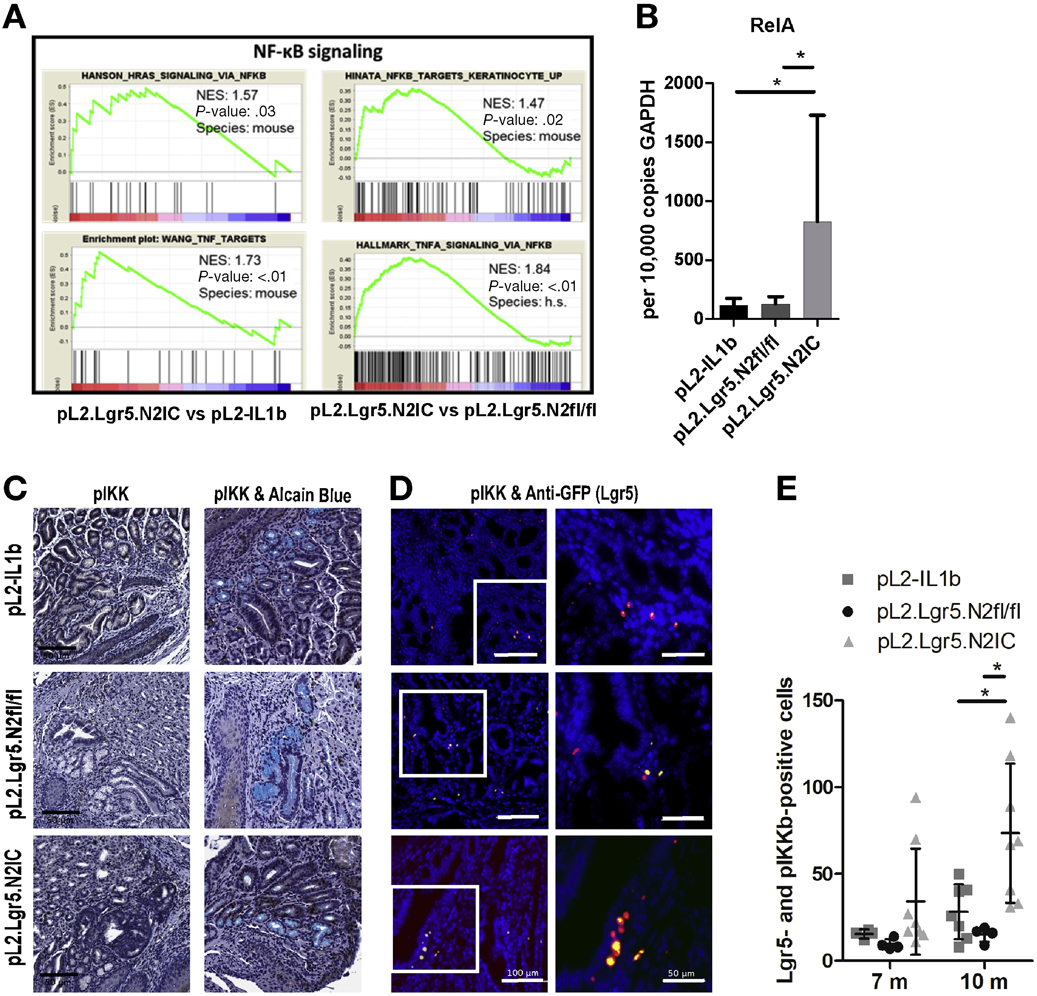
Aberrant Notch expression results in increased NF-κB in progenitor and progenitor derived cells. (A) GSEA display an enrichment of NF-κB associated gene sets in mice with overexpressed Notch2 versus mice with less Notch signalling. (B) qRT-PCR of RelA expression levels of indicated mouse strains. (C) Representative IHC images of pIKK (left) and a combinatory staining of pIKK and Alcain Blue (right) derived from mice at 7 months. (D) Exemplary immunofluorescence images of pIKK (red) and anti-GFP (Lgr5; green) staining derived from mice at 10 months. (E) Corresponding statistically summarized results in the BE region as number of positive cells in 10 high-power fields. Data is presented as means ± standard deviation. Statistical analysis was performed using one-way ANOVA and Tukey’s multiple comparison test. *p<.05.