
Figure 3. Numbers of G-CSF, AMD3100/Plerixafor, and G-CSF plus AMD3100/Plerixafor mobilized HSCs and HPCs per ml blood.
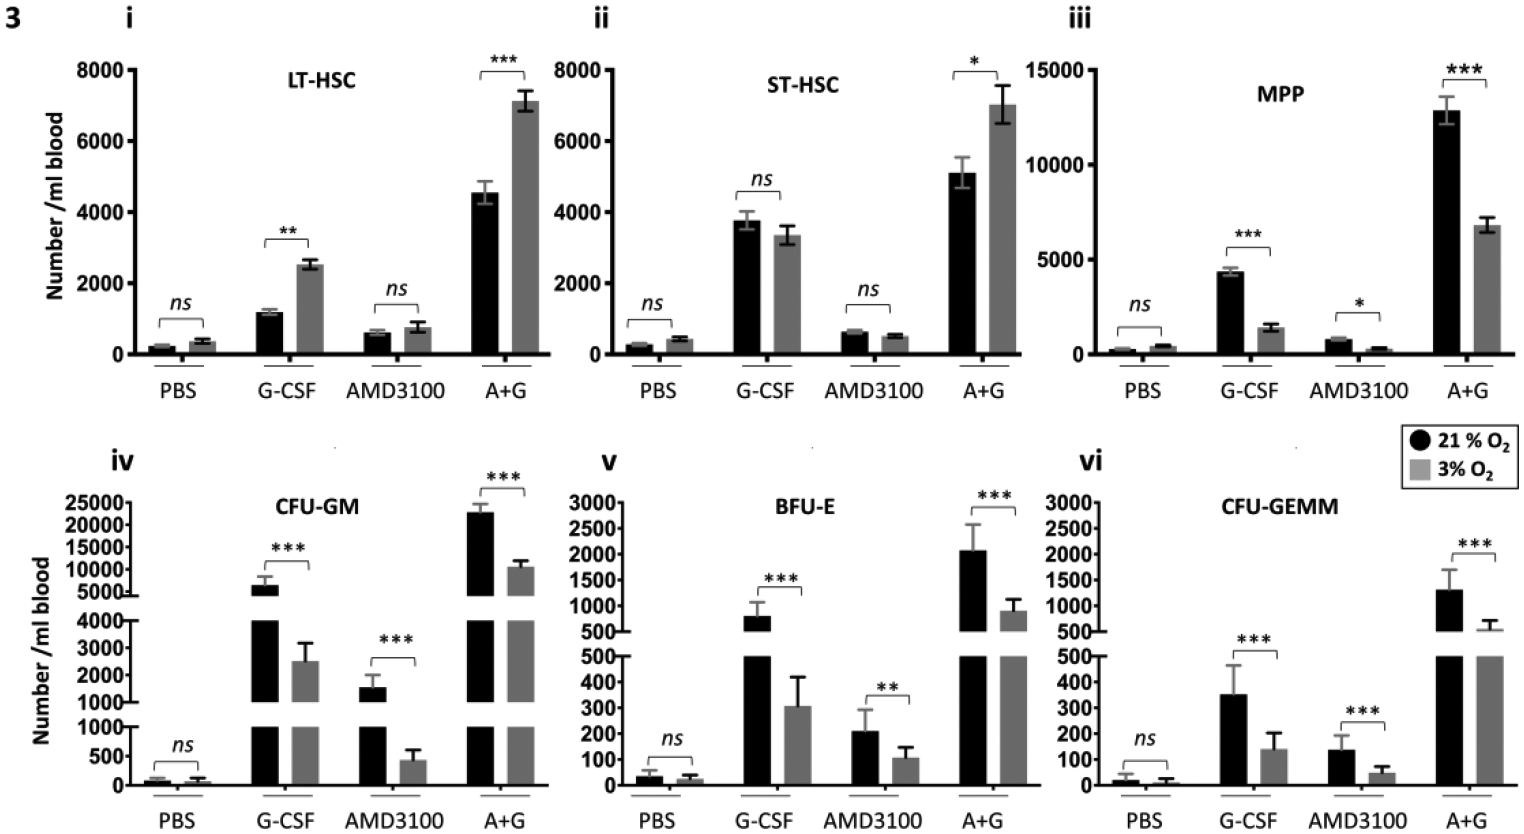
A combination of three independent experiments is shown; each experiment included three mice. PB and BM were harvested and processed in a hypoxic chamber (3% O2, 5% CO2, N2) or ambient air (~21% O2) from G-CSF and/or AMD3100/Plerixafor mobilized C57BL/6 mice and analyzed for HSC and HPC numbers. Numbers of LT-HSCs (Ai), ST-HSCs (Aii), and MPPs (Aiii) per ml blood were assessed by flow cytometry. Progenitor cell numbers were analyzed using a functional HPC colony assay examining CFU-GM (iv), BFU-E (v), and CFU-GEMM (vi) in blood. Data are presented as mean± SEM. *p < 0.05, **p < 0.05, ***p < 0.005, when analyzed by Student’s t test.