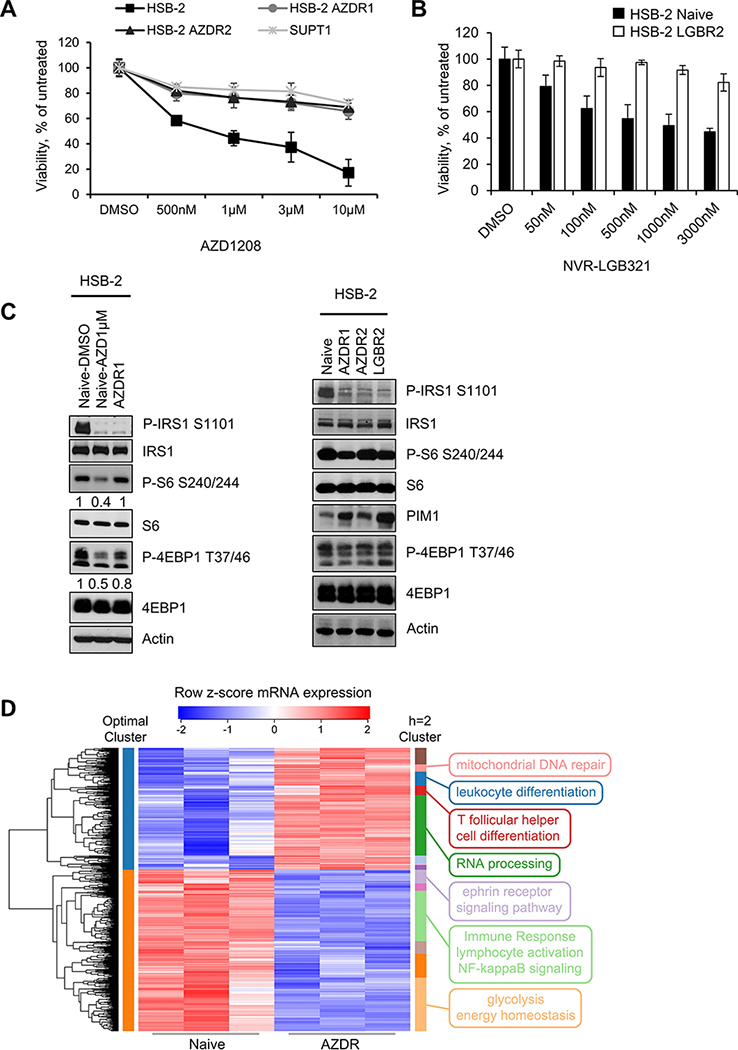
Figure 2. Characterization of HSB-2 naïve and PIMi resistant cells:
(A and B) Using an XTT assay, the percentage of viable cells was measured after each cell line was exposed to increasing doses of AZD or LGB over 72h and compared to vehicle. Data are represented as average +/− S.D of three independent experiments. (C) WB comparing the mTOR signaling activity in HSB-2 naïve (AZD1μM; 24h) and PIMi resistant cell populations. (D) Hierarchical clustering on the differentially expressed genes with high-significance (FDR<0.01) from AZDR RNA-seq data reveals significantly enriched biological pathways. The heat map represents the row z-score of log2 transformed RNA-seq count values. Optimally clustered (by silhouette width) membership is shown with colors on the left side of the heat map while clusters cut at height h=2 are shown with colors on the right side of the heat map. Selected GO term annotations of each cluster are represented on the right side of the heat map. Total of 2225 genes with n=3 in each group were analyzed for the heat map clustering analysis.

