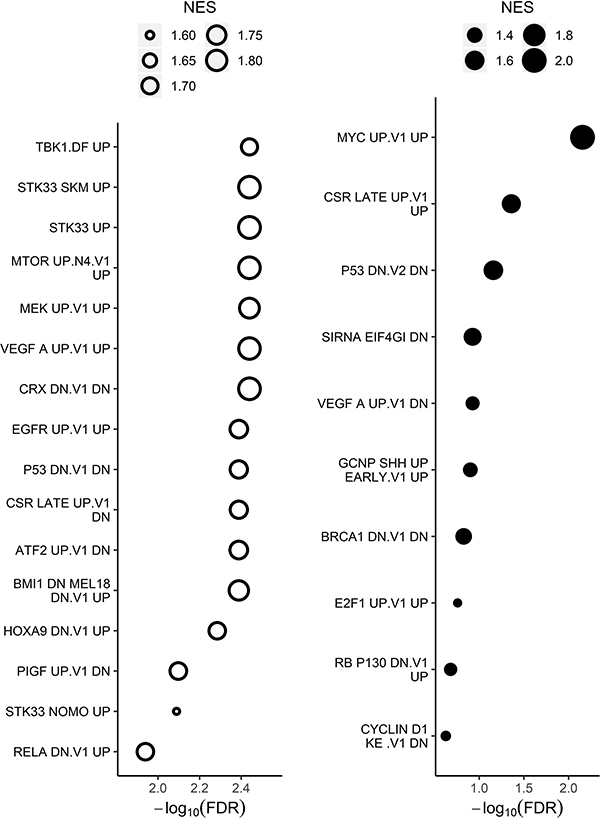
Figure 3. Oncogenic signatures enriched in transcriptome of long-term PIMi treated cells compared with HSB-2 naïve cells.
Genes were ranked by differential expression and analyzed using GSEA testing against curated oncogenic signatures. The size of the bubbles in the bubble plots represents the normalized enrichment score (NES), which summarizes the number and differential expression intensity of enriched genes. The absolute value of the NES generally varies between 0 (no enrichment) and 5 (extremely high enrichment). The significance of the pathway enrichment is measured by the FDR (x-axis). Open bubbles indicate downregulated pathways and closed indicate upregulated pathways. All oncogenic signatures shown have FDR<0.25 and GSEA significance is defined as FDR<0.25.

