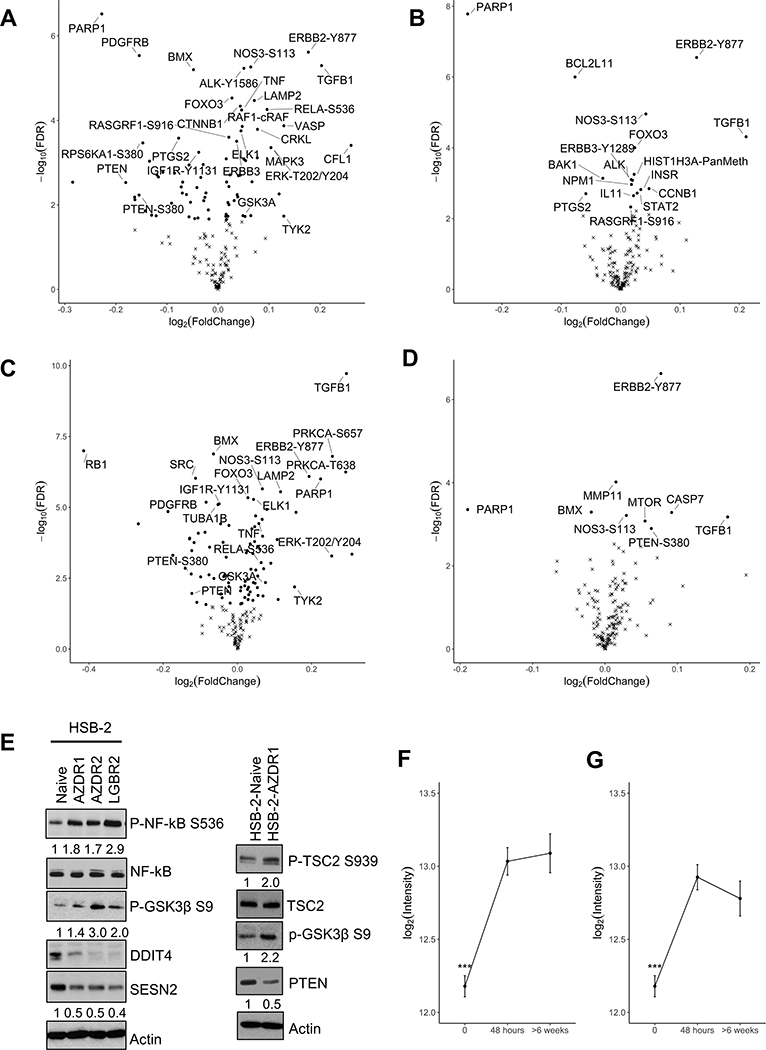
Figure 5. AZD1208 and LGB321 resistant HSB-2 cells exhibit significant changes in protein expression.
(A-D) Volcano plot (log2(fold change) as x-axis and −log10(p-value) as y-axis) of RPPA differential expression comparing HSB-2 (A) Naïve vs AZDR1, (B) AZD 1μM (short-term) vs AZDR1 (long-term), (C) Naïve vs LGBR2, and (D) LGB 1μM (short-term) vs LGBR2 (long-term) indicate that many proteins have significant changes in expression. Dots indicate Benjamin and Hochberg FDR < 0.05 and x-mark indicates FDR ≥ 0.05. (E) Validation of RPPA data generated from comparing HSB-2 naïve and AZDR1 or LGBR2 cells by WB. (F & G) RelA-S536 abundance is shown on the y-axis and time of treatment with PIMi on the x-axis. Total of 200 proteins were analyzed with n=6 for each sample. Results are expressed as mean+/−S.E.M; ***p-value<0.001; ****p-value < 0.0001.

