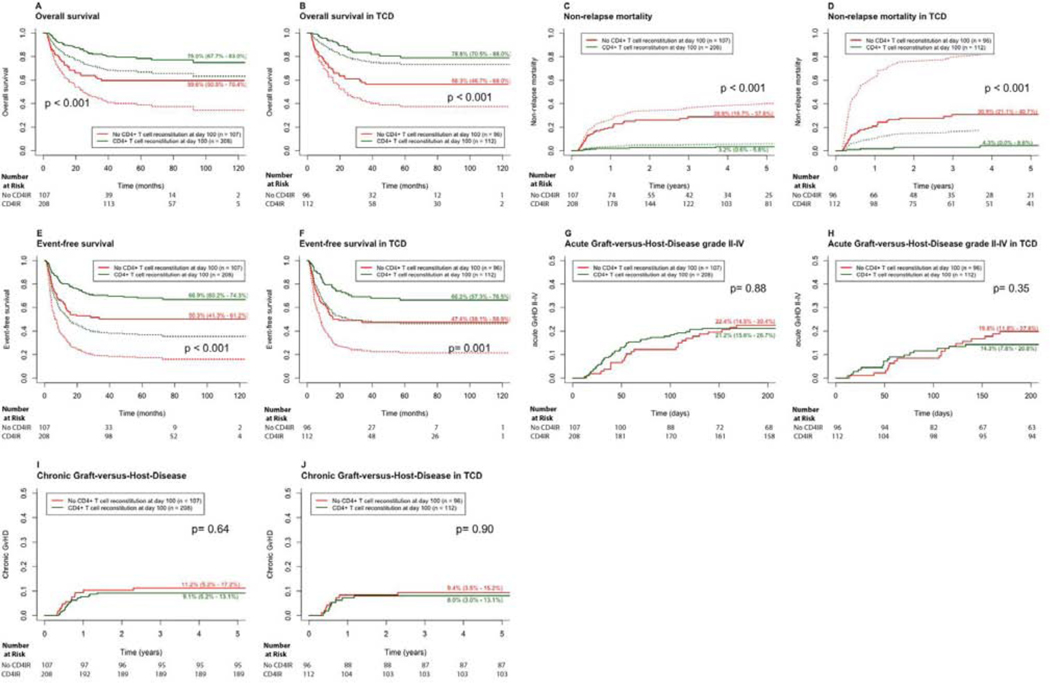
Figure 5.
Outcomes according to CD4+ T cell IR. Plots on the left (A, C, E) show results in all (whole cohort) patients. Plots on the right (B, D, F) show results in T cell depleted patients. Red lines show patients without CD4 IR, green lines patients with CD4 IR. Dotted lines show adjusted curves; curves for NRM, OS and EFS are adjusted for significant predictors from multivariate analysis (Table 2). (A) NRM according to CD4 IR. (B) NRM according to CD4 IR in TCD. (C) OS according to CD4 IR. (D) OS according to CD4 IR in TCD. (E) EFS according to CD4 IR. (F) EFS according to CD4 IR in TCD. (G) aGvHD according to CD4 IR. (H) aGvHD according to CD4 IR in TCD. (I) cGvHD (all) according to CD4 IR. (J) cGvHD (all) according to CD4 IR in TCD.

