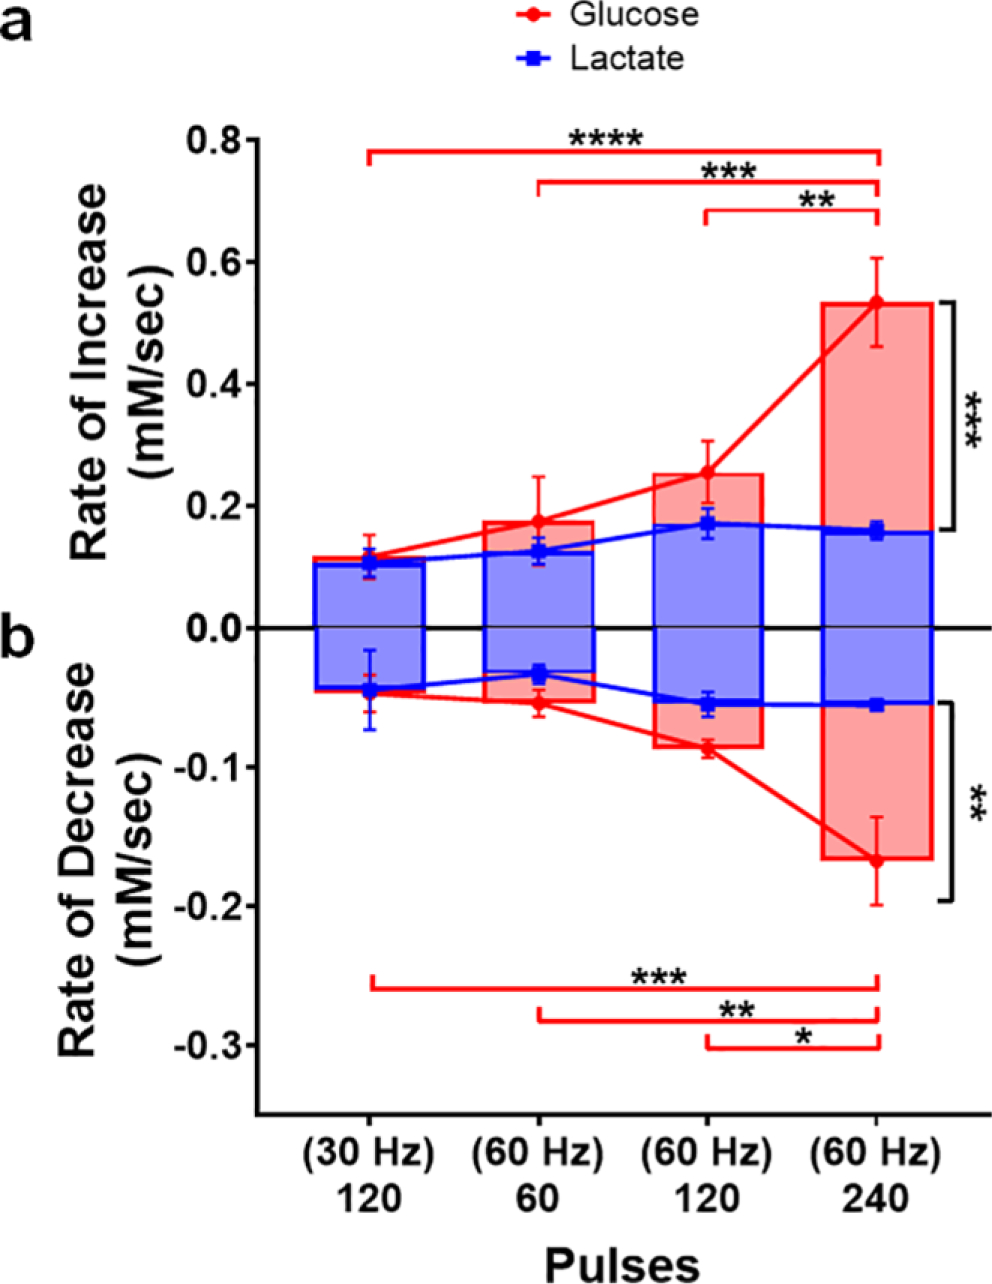
Fig. 7.

The relative rates of striatal glucose and lactate dynamics evoked in response to midbrain stimulation. (a) Rates at which extracellular glucose and lactate concentrations increased were calculated by dividing the amplitude of the increase by peak latency. Glucose and lactate were supplied at the same rate in response to the more modest stimulations, but glucose concentrations rose significantly faster as the number of stimulation pulses (60 Hz) increased (** p < 0.01 - **** p < 0.0001). (b) The relative rates at which glucose and lactate concentrations fell were similarly calculated, but the total concentration range covered by the initial rise and subsequent fall was divided by the time between the peak and the valley in the concentration trace. Glucose and lactate were consumed at the same rate in response to modest stimulations, but glucose was consumed at increasingly faster rates as the stimulation intensified (*p < 0.05 - ***p < 0.001). Conversely, the rate of lactate consumption remained consistent across all stimulation conditions investigated.
