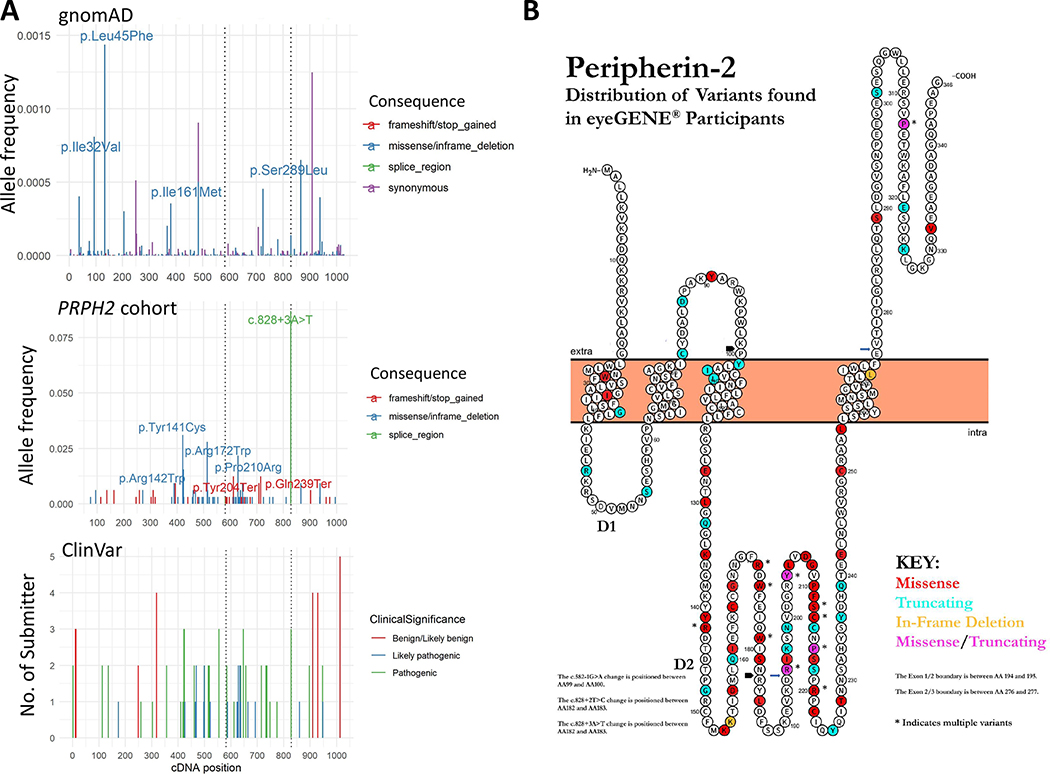
Figure 3. Schematic Representations of Peripherin-2 Protein and cDNA Positions of Variants and Allele Frequencies in eyeGENE® Probands and gnomAD:
A: Top, PRPH2 gnomAD allele frequencies by cDNA position and variant type, only variants with gnomAD allele frequencies less than 0.5 are shown. Middle, cDNA variant location and allele frequencies in eyeGENE® probands. Bottom, cDNA variant location and number of submitters in ClinVar. B: Schematic representation of Peripherin-2 protein with the distribution of variants found in eyeGENE® participants by color. D1 and D2 represent the two intradiskal loops. The N and C termini are located in the space between the disk membrane and the rod outer segment plasma membrane, with the fusion peptide region from a.a. 312 to 326. Missense variants are indicated in red, truncating variants in blue, in-frame deletions in orange, and sites with both missense and truncating variants in pink. Figure created and modified from Protter (Omasits, Ahrens, Muller, & Wollscheid, 2014).

