
Figure 3.
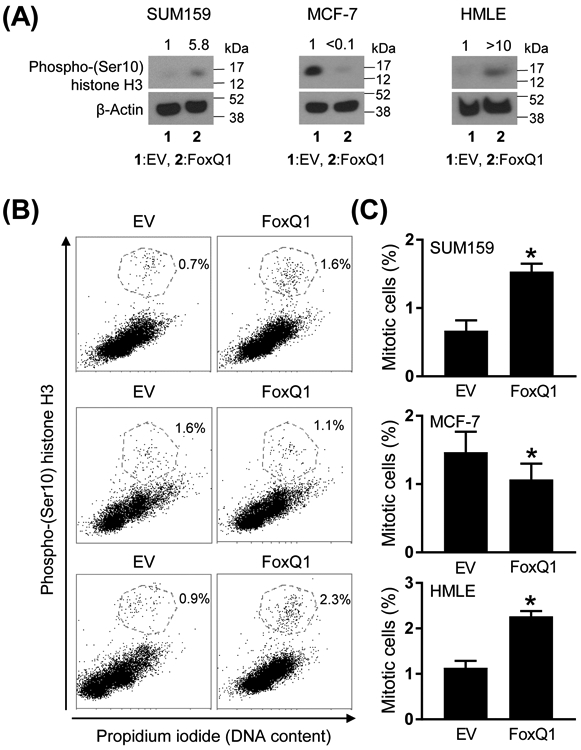
FoxQ1 overexpression resulted in mitotic arrest. A, Western blot analysis for phospho-(Ser10) histone H3 protein using lysates from EV cells or FoxQ1 overexpressing SUM159, MCF-7, and HMLE cells. The numbers on top of the bands represent changes in protein level compared to corresponding EV cells. B, Representative flow histograms showing mitotic fraction in EV cells or FoxQ1 overexpressing SUM159, MCF-7, and HMLE cells. C, Quantitation of mitotic fraction. Data shown are mean ± SD (n = 3-6). *P < 0.05 by two-sided Student's t-test. Experiments were done twice with comparable results.