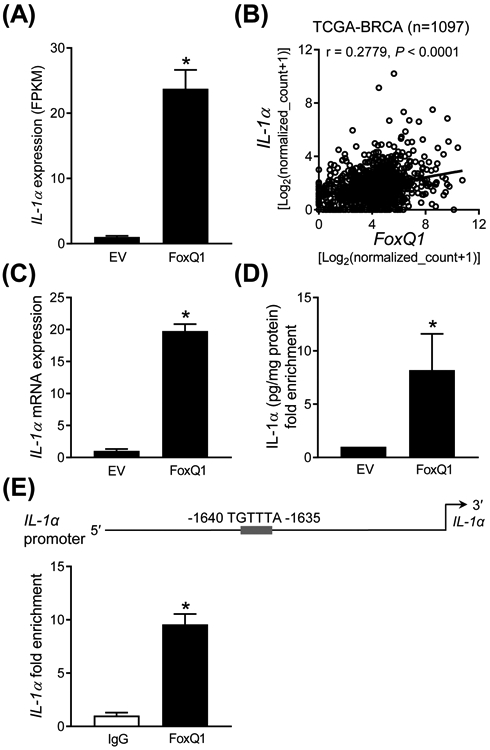
Figure 4.

FoxQ1 is a novel regulator of IL-1α. A, RNA-seq analysis of IL-1α gene expression in EV cells FoxQ1 overexpressing SUM159 cells. Data shown are mean ± SD (n = 3). *P < 0.05 by two-sided Student's t-test. B, Positive correlation between FoxQ1 and IL-1α expression in breast tumor TCGA dataset (n = 1097). Pearson's test was used to determine statistical significance of the correlation. C, Quantification of IL-1α mRNA expression in EV and FoxQ1 overexpressing SUM159 cells. Data shown are mean ± SD (n = 3). *P < 0.05 by two-sided Student's t-test. D, Quantification of IL-1α secretion in the media of EV or FoxQ1 overexpressing SUM159 cells. Data shown are mean ± SD (n = 3). *P < 0.05 by two-sided Student's t-test. E, Identification of a putative FoxQ1 binding site in the promoter region of IL-1α in SUM159 cells.. The bar graph shows recruitment of FoxQ1 at the IL-1α promoter by ChIP analysis. The results shown are mean ± SD (n = 3). *P < 0.05 by two-sided Student's t-test. Experiments were done twice with similar results.
