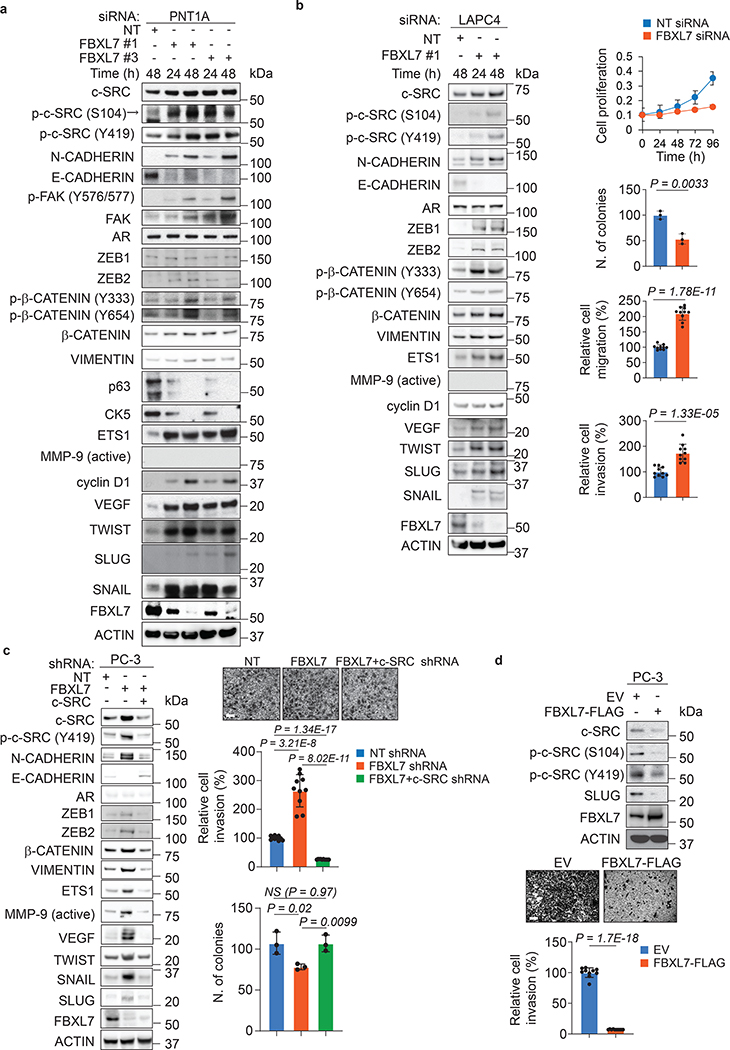
Fig. 4. FBXL7 downregulation promotes expression of EMT markers and cell invasion in a c-SRC-dependent manner.
a, PNT1A cells were transfected with two different siRNAs to FBXL7 (individually) or a NT siRNA. At the indicated times after transfection, cells were subjected to immunoblotting. Three independent experiments were performed with similar results.
b, LAPC4 cells were transfected with an siRNA to FBXL7 (FBXL7si oligo #1) or a NT siRNA. At the indicated times after transfection, cells were subjected to immunoblotting (left panel) or plated in a 96-well plate, on a soft-agar layer, on a transwell in the presence of Collagen type I in the lower chamber as chemoattractant, or on Matrigel-coated transwells (top to bottom panels: cell proliferation, colony formation, migration, and invasion assay, respectively). A representative proliferation experiment performed in triplicate, out of two independent experiments, is shown. Colony formation assay: n = 3 independent experiments. After 6 h (migration) or 48 h (invasion), cells were fixed, stained, photographed, and counted in 10 different fields/well. A representative migration and invasion experiment out of two independent experiments/each is shown (n = 10). Mean ± s.d. is shown; P values are from unpaired, two-tailed t-test.
c, PC-3 cells were stably transduced with the indicated doxycycline-inducible shRNAs. Twenty-four hours after doxycycline induction, cells were subjected to immunoblotting (left panel) or re-plated on Matrigel-coated transwells (upper and middle right panels). After 48 h, cells that invaded through Matrigel were counted in 10 different fields/well. In the bottom, right panel, cells were assayed for anchorage-independent growth three weeks after being plated in soft agar (n = 3 independent experiments; mean ± s.d. is shown). A representative invasion experiment out of two independent experiments is shown. Scale bar: 40 μm. Mean ± s.d. is shown; n = 10; P values are from unpaired, two-tailed t-test.
d, PC-3 cells were transfected with FLAG-tagged FBXL7 or EV. Twenty-four hours after transfection, cells were subjected to immunoblotting (top panel; two representative experiments were performed with similar results) or re-plated on Matrigel-coated transwells (bottom panels). After 72 h, cells invaded through Matrigel and migrated on the bottom of the transwells were counted in 10 different fields/well. The graph shows quantification from a representative experiment out of two. Scale bar: 40 μm. Mean ± s.d. is shown; n = 10; P values are from unpaired, two-tailed t-test.

