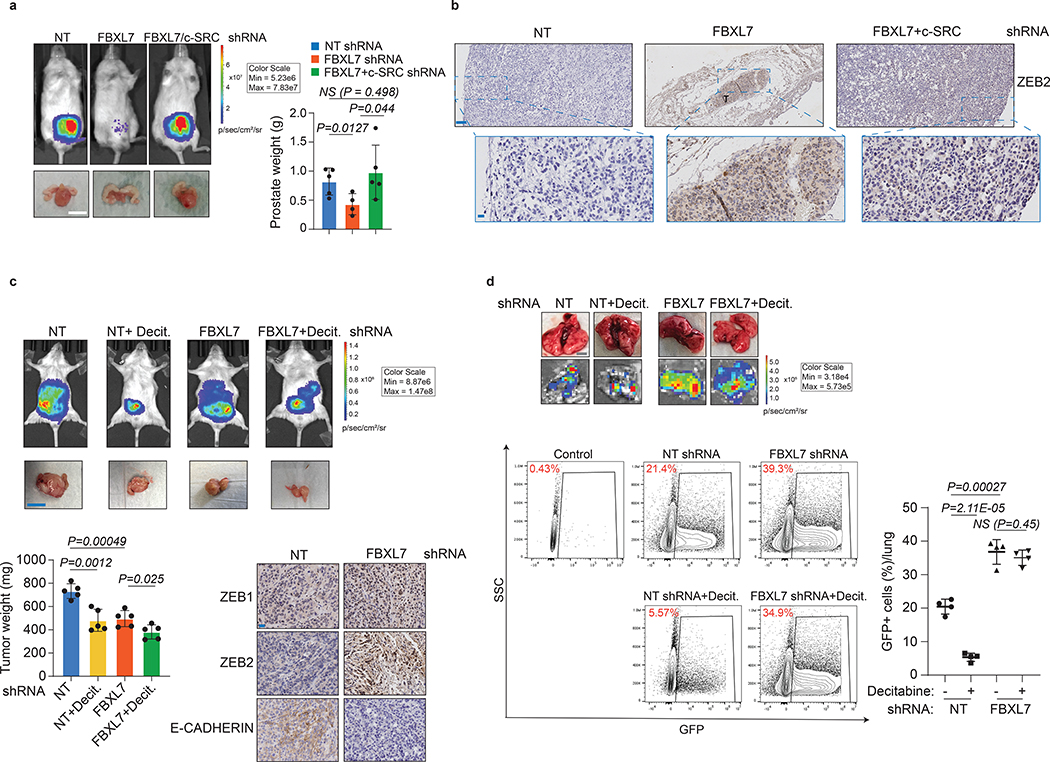
Fig. 7. FBXL7 suppression promotes prostate cancer metastasis, which is counteracted by co-silencing c-SRC or decitabine treatment.
a, NOD/SCID-gamma mice were inoculated in the ventral prostate with 5 × 10⁵ PC-3 cells stably expressing both luciferase and the indicated doxycycline-inducible shRNAs. NT = non-targeting shRNA. Orthotopically transplanted mice were then treated with doxycycline to induce shRNA expression (NT shRNA: n = 5; FBXL7 shRNA: n = 7; FBXL7/c-SRC shRNA: n = 10). Top left panels, representative bioluminescent images taken at the end of the experiment. Two independent experiments were performed. Bottom left panels, representative excised prostates with tumors imaged 60 days post-injection. Scale bar: 1 cm. Right panel, quantification of prostate weights. Mean ± s.d. is shown. P values are from unpaired, two-tailed t-test.
b, Representative immunohistochemical staining of ZEB2 in primary tumor sections from mice shown in (a). n = 3. Scale bars: 100 μM (top), 10 μM (bottom). T = tumor.
c-d, NOD/SCID-gamma mice were inoculated in the ventral prostate with 5 × 10⁵ PC-3M cells stably expressing luciferase, GFP, and the indicated shRNAs. Orthotopic transplanted mice were treated with decitabine (Decit.) or vehicle once a week by intraperitoneal injection at 1 μg/g body weight up to 40 days post-implantation. Two independent experiments were performed with similar results. In c, top panels, representative mice imaged with BLI at the end of the experiment; middle panels, representative excised prostates with tumors imaged 40 days post-injection (scale bar: 1 cm); bottom left panels, quantification of tumor weight (n = 5 mice per group). Mean ± s.d. is shown. P values are from unpaired, two-tailed t-test. Bottom right panels, representative immunohistochemical staining of ZEB1, ZEB2 and E-CADHERIN in primary tumors (scale bar: 10 μm). In d, lungs were excised, imaged with BLI and subjected to FACS analysis for GFP-positive cells (bottom panels). Control: lung from non-transplanted mouse. Scale bar: 5 mm. The graph on the right shows the percentage of GFP+ cells/lung (n = 4 mice per group). Mean ± s.d. is shown. P values are from unpaired, two-tailed t-test.

