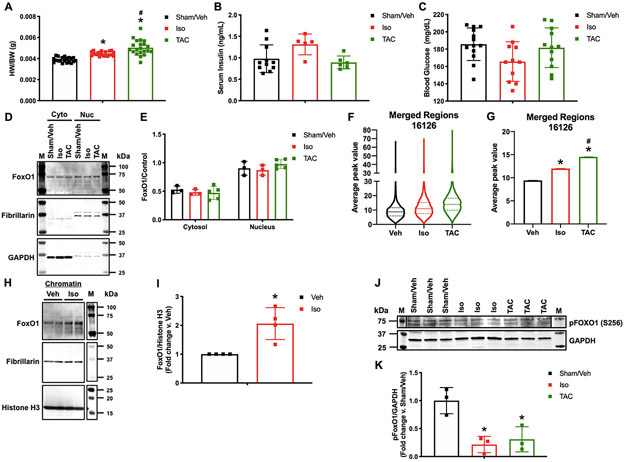
Figure 1. FoxO1 chromatin binding positively correlates with cardiac hypertrophy.
Adult (12-week-old), male C57Bl/6 mice were treated with isoproterenol (Iso) (3 mg/kg/day) or subjected to transverse aortic constriction (TAC) surgery for 7 days. Controls were sham operated and injected with vehicle (Sham/Veh) for 7 days. A Hearts were harvested and weighed. Heart weights (HW) were normalized to body weights (BW) and plotted as a ratio (HW/BW) in grams (g). n=20, 20, 21 (Sham, Iso, TAC). B Serum insulin levels were assessed using ELISA for mouse insulin. Concentrations are plotted as ng/mL. n=7, 7, 4 (Sham, Iso, TAC). C Blood glucose levels were assessed using glucose meter. Concentrations are plotted as mg/dL. n=13, 11, 12 (Sham, Iso, TAC). D-E Hearts were harvested, lysed, and the cytosolic (Cyto) or nuclear (Nuc) fractions extracted. Lysates were subjected to Western blotting using the indicated antibodies. Signals from the different proteins were quantified using densitometry, normalized to loading controls (GAPDH or Fibrillarin for cytosolic or nuclear fractions, respectively) and plotted. n=3, 3, 5 (Sham, Iso, TAC). F-G 5 hearts per group (Sham/Veh, Iso, TAC) were pooled, fixed, processed for chromatin extraction, and subjected to forkhead box protein (Fox)O1 ChIP-Seq. Average peak values were plotted for all merged regions and represented as violin plots showing the median, quartiles, and distribution (F) or as bar graphs representing the mean (G). H-I NRVM were cultured, infected with Ad.FoxO1 (MOI=1), and treated with 10 μM Iso or Veh control at 0 and 24 h. Chromatin fractions were extracted at 48 h and subjected to Western blotting using the indicated antibodies. Signals from the different proteins were quantified using densitometry and FoxO1 was normalized to histone H3 and plotted as fold change versus Veh. n=4, 4 (Veh, Iso). J-K Hearts were harvested, lysed, and subjected to Western blotting using the indicated antibodies. Signals from the different proteins were quantified using densitometry, normalized to the GAPDH loading control and plotted. n=3, 3, 3 (Sham, Iso, TAC). Error bars represent SEM. *p<0.05 Iso or TAC versus Sham/Veh and #p<0.05 TAC versus Iso using 1-way ANOVA. *p<0.05 Iso versus Veh using t-test. M=marker.

