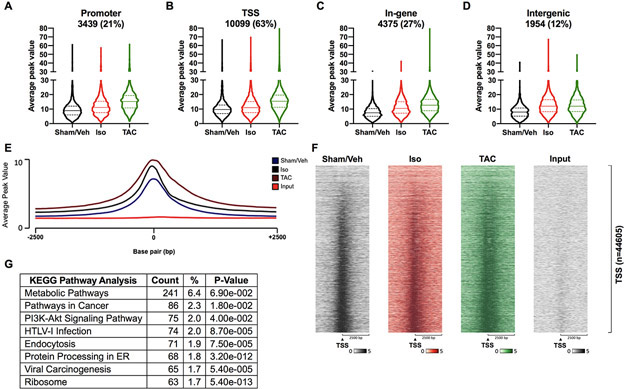
Figure 2. FoxO1 is primarily detected at transcription start sites of genes.
Forkhead box protein (Fox)O1 ChIP-Seq was performed as described in Figure 1. A-D FoxO1-bound merged regions were sorted by genomic region. Promoter represents −1000 to −10000 bp relative to the transcription start site (TSS). TSS represents −1000 to +1000 bp relative to the TSS. Intergenic represents those no represented in the promoter, TSS, or In-gene. Average peak values were plotted and represented as violin plots showing the median, quartiles, and distribution. Percentages represent the fraction of FoxO1 bound to a particular genomic region relative to all of the FoxO1-bound merged regions (16126). Merged regions can be present in one or more genomic regions. E Average peak values (y-axis) were plotted versus sequencing tags across the TSS (−2500 bp to +2500 bp relative to the TSS) (x-axis) (EaSeq software). F Sequencing tags distribution (y-axis) across the TSS (−2500 bp to +2500 bp relative to the TSS) (x-axis) are represented as heatmaps. G KEGG pathway enrichment analysis was performed using The Database for Annotation, Visualization, and Integrated Discovery (DAVID) for the merged regions containing FoxO1 at the TSS (B), for Sham/Vehicle (Veh), isoproterenol (Iso), and transverse aortic constriction (TAC). Shown are the top 8 most highly represented pathways. PI3K=Phosphatidylinositol 3-kinase; HTLV-1=Human T-cell leukemia virus 1.

