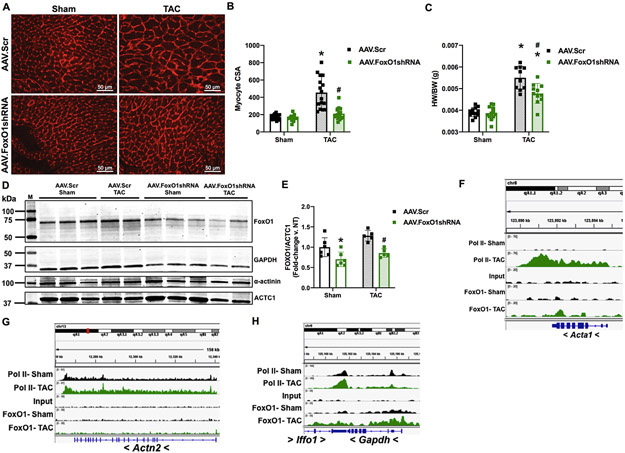
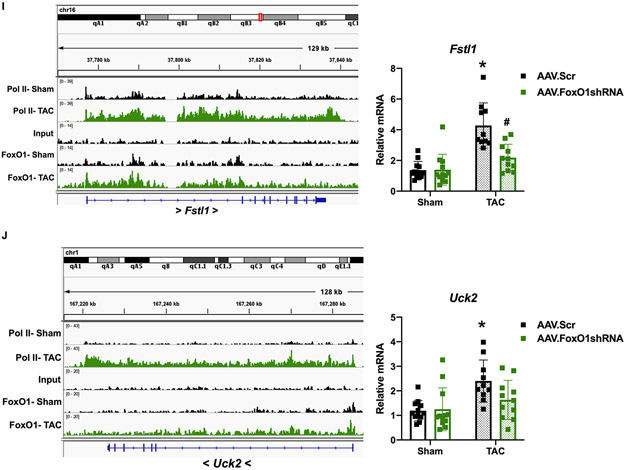
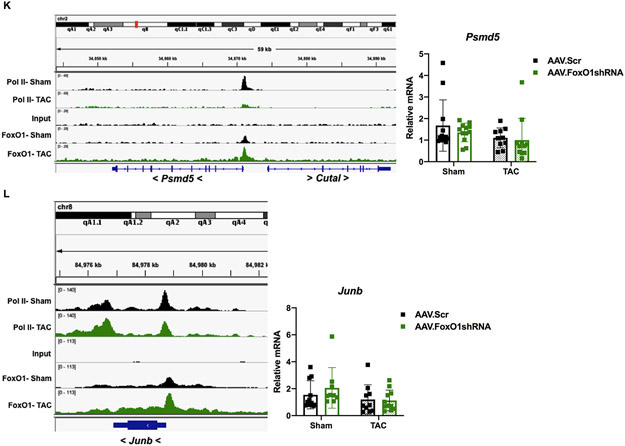
Figure 6. FoxO1 knockdown prevents hypertrophic gene expression and cardiomyocyte hypertophy in vivo.
A-E, I-L Adult (12-week-old), male mice were injected with adeno-associated virus (AAV).Scr or AAV.FoxO1shRNA (1x10¹² GC/mL) for two days and then subjected to transverse aortic constriction (TAC) or sham surgery for 7 days. A-B Hearts were harvested, fixed, and stained with 594 WGA. Representative images are shown in A. Cell cross-sectional area (CSA) was quantified using ImageJ software and plotted (B). Cardiomyocytes imaged= 16, 16, 16, 16 (Sham/AAV.Scr, Sham/AAV.FoxO1shRNA, TAC/AAV.Scr, TAC/AAV.FoxO1shRNA). C Hearts were harvested and weighed. Heart weights (HW) were normalized to body weights (BW) and plotted as a ratio (HW/BW) in grams. n=12, 12, 10, 11 (Sham/AAV.Scr, Sham/AAV.FoxO1shRNA, TAC/AAV.Scr, TAC/AAV.FoxO1shRNA). D-E Hearts were harvested, lysed, and subjected to Western blotting using the indicated antibodies. Signals for forkhead box protein (Fox)O1 were quantified using densitometry, normalized to the cardiac alpha-actin (ACTC1) loading control, and plotted. n=6, 6, 5, 5 (Sham/AAV.Scr, Sham/AAV.FoxO1shRNA, TAC/AAV.Scr, TAC/AAV.FoxO1shRNA). F-L FoxO1 and RNA polymerase (pol)II ChIP-Seq were performed in Sham and TAC hearts as described in Figure 1. IGV software was used to view the fragment densities of pol II and FoxO1 (y-axis) aligned along the gene coordinates (x-axis). Shown are exemplary images for the indicated genes. I-L Hearts were harvested, total RNA was extracted, and qPCR was performed for the indicated genes. The results were plotted (Right panels). n=12, 12, 10, 11 (Fstl1, Uck2, Psmd5) and n=11, 9, 10, 11 (Junb) (Sham/AAV.Scr, Sham/AAV.FoxO1shRNA, TAC/AAV.Scr, TAC/AAV.FoxO1shRNA). Error bars represent SEM. *p<0.05 versus Sham/AAV.Scr and #p<0.05 versus TAC/AAV.Scr using 2-way ANOVA. M=marker; Scr=Scrambled; shRNA=Short hairpin RNA; NT=Non-treated; Acta1=Actin alpha 1; Actn2=Actinin alpha 2; Fstl1=Follistatin-related protein 1; Uck2=Uridine-cytidine kinase 2.


