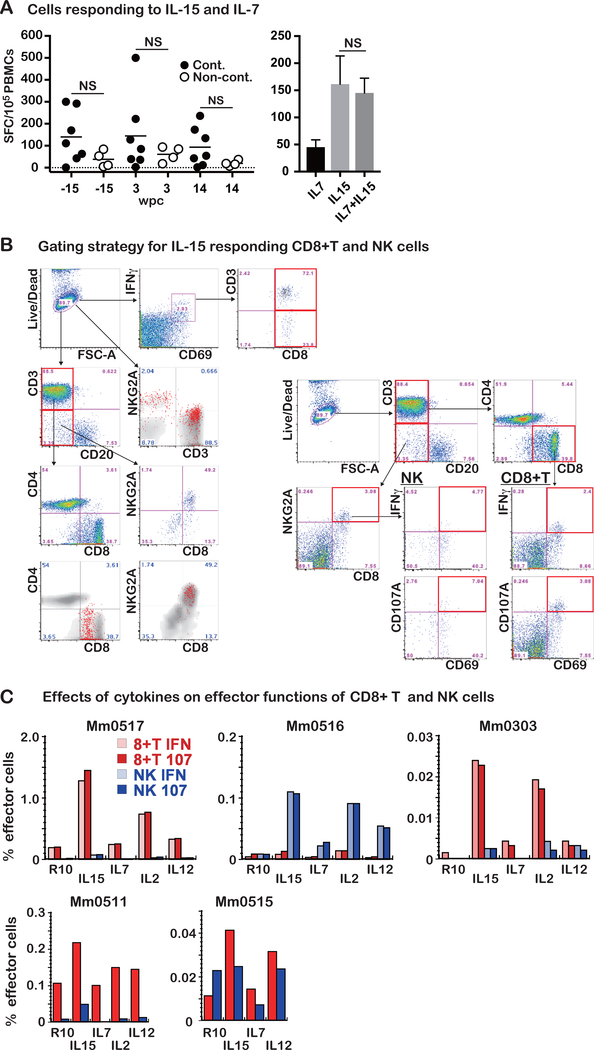
Fig. 2. CD8+ T and NK cells are main cells stimulated with IL-15.
A. Left panel: Stimulation of PBMCs from the seven controller and four non-controller animals were incubated in vitro with a mixture of rIL-7 and rIL-15 overnight and the frequencies of IFNγ expressing cells using a standard ELISPOT assay. Data shown are results obtained from PBMC samples collected at −15, 3, and 14 wpc. As noted, the frequencies of IFNγ synthesizing cells were higher in the controllers (n =7) compared with those in the non-controllers (n = 4), although the difference was not statistically significant (NS, p > 0.05). Right panel: Comparison of the effects of rIL-7 and rIL-15 alone or in combination. Frequencies of IFNγ expressing cells in PBMCs from the animals (n = 4) following in vitro incubation overnight with either rIL-7, rIL-15, or a cocktail of rIL-7 and rIL-15. The stimulation with IL-15 resulted in similar SFC to that with the cocktail: correlation (r = 0.905) and no statistical difference (p > 0.05). The results are shown as mean and SD.
B. Left panel: Results from the flow cytometric analyses of PBMCs from the controller (Mm0517, 45 wpc) show that the IFNγ−synthesizing cells following incubation overnight with rIL-15 in vitro comprised both CD8+ T cells and CD3-CD8+NKG2A+ (NK) cells. To identify phenotypic properties of IFNγ−synthesizing cells (shown in red), IFNγ+CD69+ cells, IFNγ+CD69+CD3+CD8+ cells, and IFNγ+CD69+CD3−CD8+ cells were overlapped to the relevant gating panels. Right panel: The frequencies of IFNγ− and CD107− expressing CD8+ T and CD3-CD8+NKG2A+ NK cells were analyzed by the gating strategy as shown.
C: The in vitro stimulatory effects of the common γ chain cytokines (IL-2, IL-7 and IL-15) and IL-12 were compared. The degree of stimulation was rank ordered as: IL-15 >IL-2 >IL-12≧IL-7. The frequencies of CD8+ T and CD3-CD8+NKG2A+ NK cells stimulated with these cytokines varied among animals. However, the predominant phenotypes stimulated were CD8+ T and CD3-CD8+NKG2A+ NK cells in PBMC samples from Mm0517, Mm0516, Mm0303, Mm0511 and Mm0515. The frequencies of IFNγ- and/or CD107a-expressing cells were similar as shown, since most stimulated cells expressed both IFNγ and CD107a (data not shown). R10: RPMI1640 media supplemented with 10% FCS

