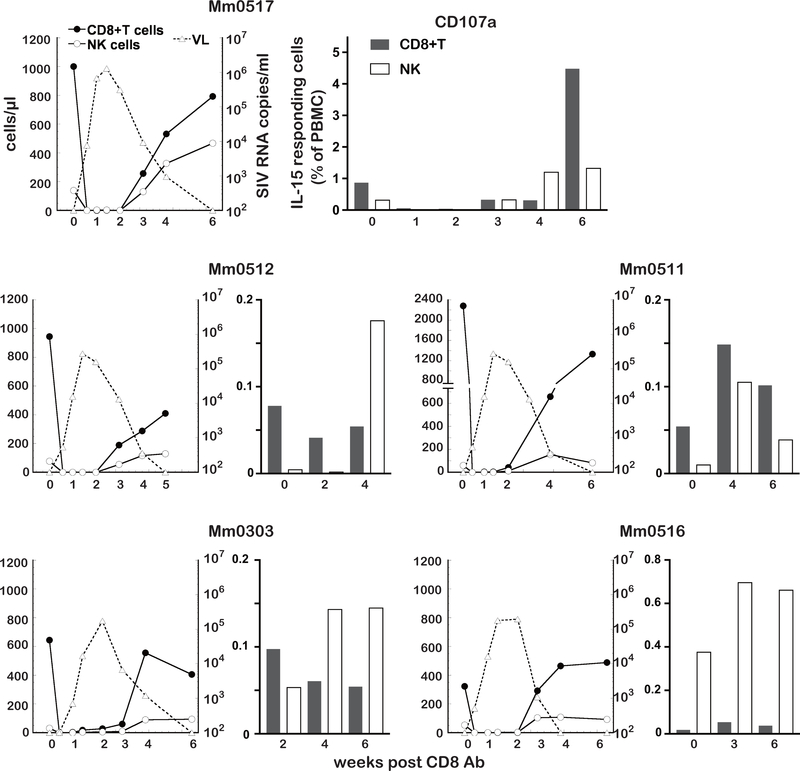
Fig. 6. IL-15 responding cells increase consistent with control of viral rebound by CD8 Ab administration.
To examine levels of IL-15 responding cells, PBMC samples collected from the CD8 Ab treated animals were subjected to the ex-vivo assay described.
Left panels: Relation between the kinetics of depletion of CD8+ T cells (closed circle) and NK cells (open circle) and viral rebound (open triangle) in 5 controller animals (Mm0517, Mm0512, Mm0511, Mm0303 and Mm0516).
Right panels: Frequencies of CD107a+CD8+ T cells (gray) and CD107a+NK (white) cells in PBMCs from the same 5 controller monkeys obtained at various times post depletion of CD8- expressing cells using the CD8 Ab.

