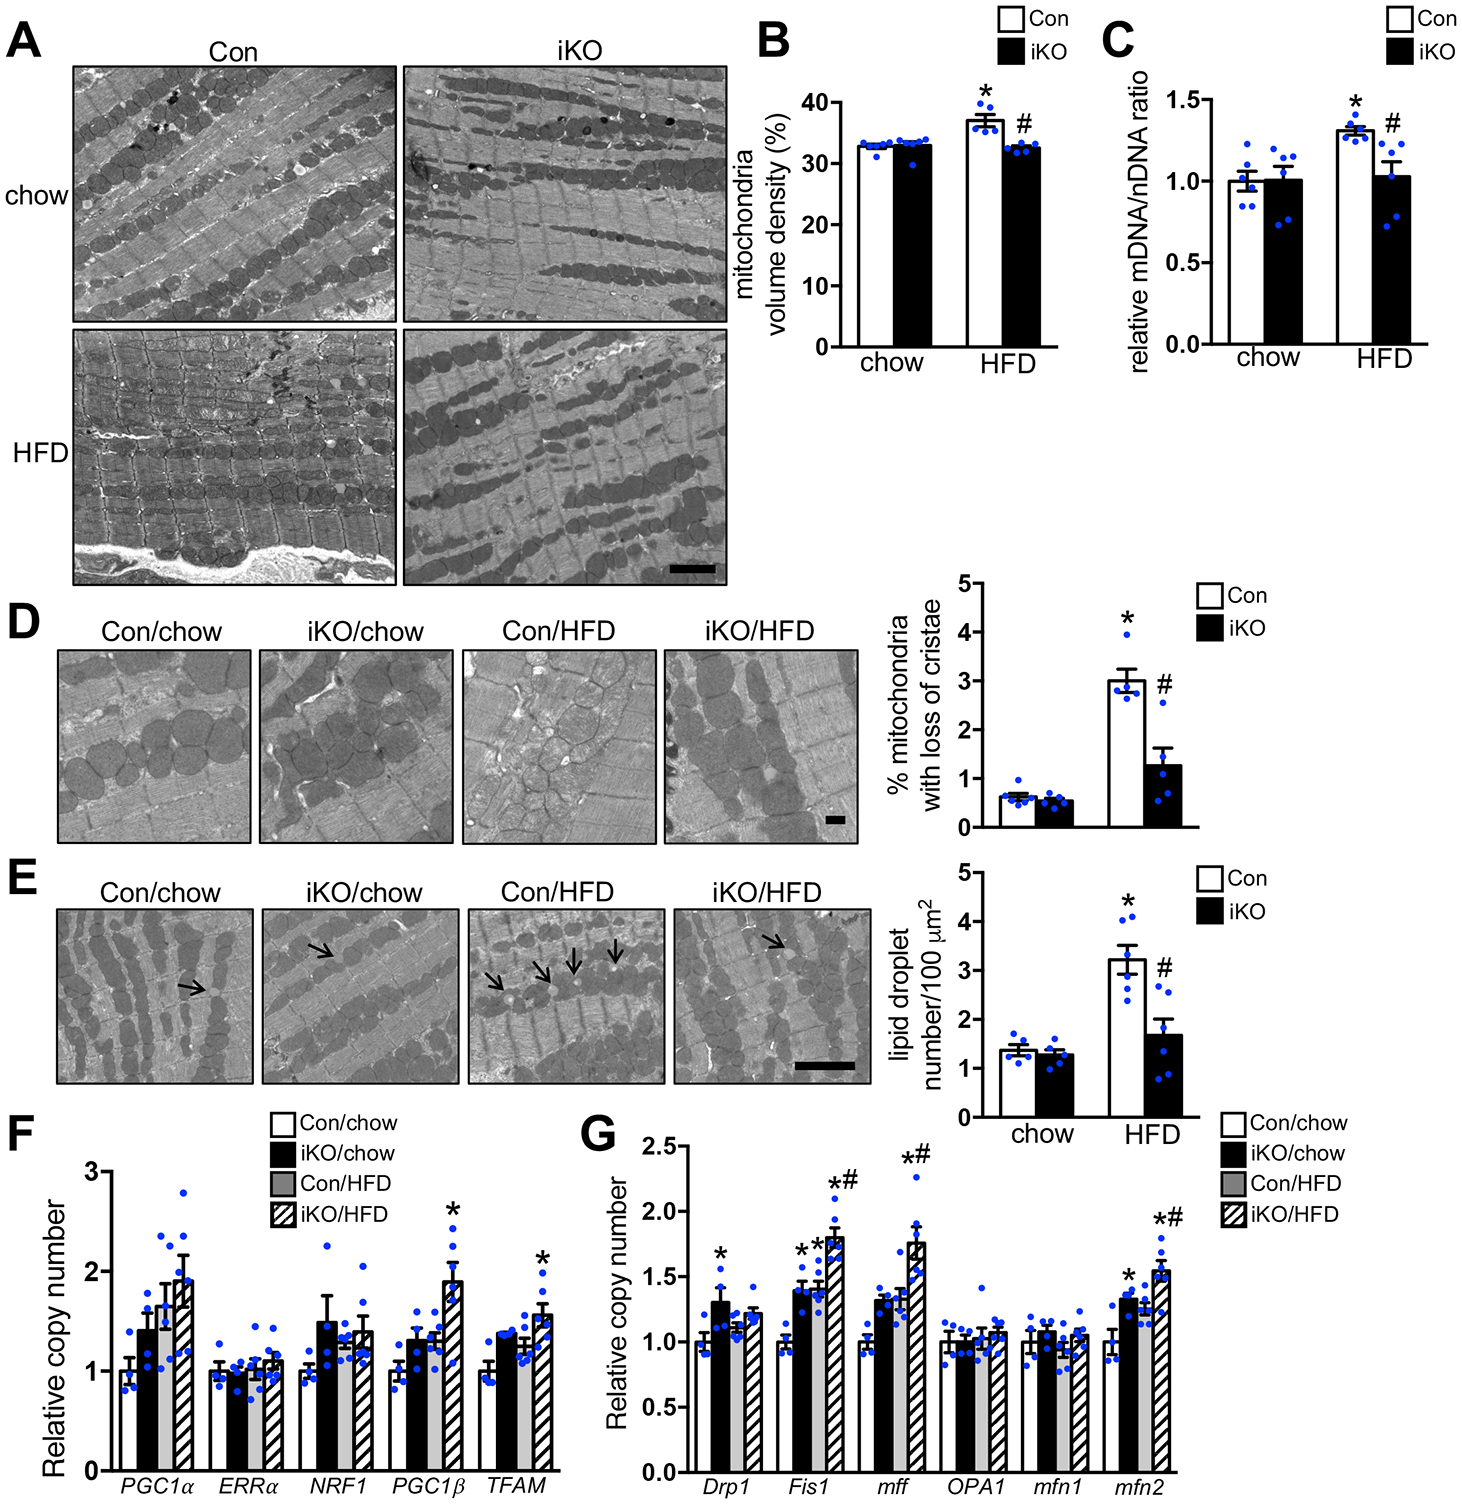
Figure 3. Increasing FAO prevented the accumulation of damaged mitochondria in vivo.

Con and ACC2 iKO mice were subjected to chow or HFD feeding for 24 weeks. (A) Representative images of heart sections from electron microcopy, Scale bar 2μm. (B) Mitochondria density was determined by the percentage of mitochondria area per field area. (*p<0.05 vs. Con/chow, #p<0.05 vs. Con/HFD, 10–15 random fields (10000x) per heart, n=5–6). (C) The ratio of mitochondrial DNA (mDNA) to nuclear DNA (nDNA) was determined by RT-PCR and represented as fold change compared with Con-chow, arbitrarily defined as 1. (*p<0.05 vs. Con/chow, #p<0.05 vs. Con/HFD, n=6). (D) (Left) Representative EM image showing disarrayed cristae and reduced electron density of the matrix in the mitochondria of Con-HFD heart but not ACC2 iKO-HFD heart. Scale bar 500nm. (Right) Quantification of the percent of damaged mitochondria. About 12–15 random fields with 1500–1800 mitochondria were analyzed per heart sample (*p<0.05 vs. Con/chow, #p<0.05 vs. Con/HFD, n=5–6). (E) (Left) Representative EM image showing lipid droplet accumulation in the Con-HFD heart but not in ACC2 iKO-HFD heart, arrows indicate lipid droplets. Scale bar 2μm. (Right) Quantification of the lipid droplet number (*p<0.05 vs. Con/chow, #p<0.05 vs. Con/HFD, 10–15 random fields (10000x) per heart sample, n=5–6). (F) qRT-PCR measurements of indicated genes involved in mitochondria biogenesis (*p<0.05 vs. Con/chow, n=4–6). (G) qRT-PCR measurements of indicated genes involved in mitochondria fusion and fission process (*p<0.05 vs. Con/chow, #p<0.05 vs. Con/HFD, n=4–6).
