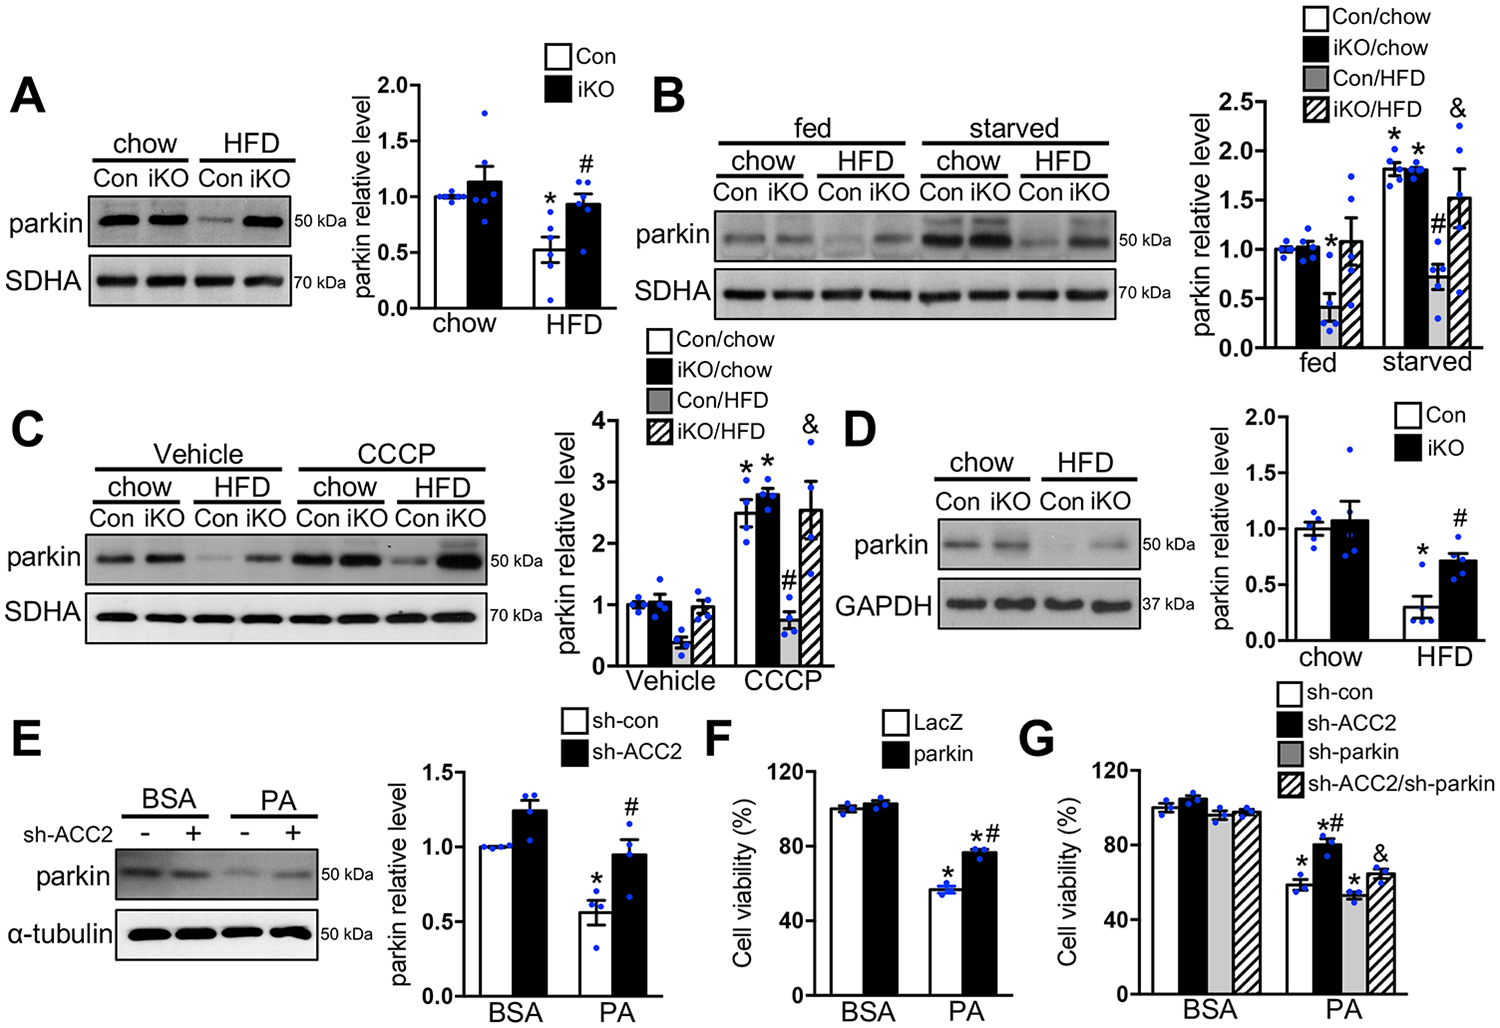
Figure 6. Increasing FAO prevented lipid induced downregulation of parkin.

(A-D) Con and ACC2 iKO mice were subjected to chow or HFD feeding for 24 weeks. (A) Representative immunoblots of parkin and SDHA in mitochondria homogenates (left) and statistical analysis of densitomeric measurement of parkin (right) is shown (*p<0.05 vs. Con/chow, #p<0.05 vs. Con/HFD, n=6). After 24-hour starvation (B) or 12-hour CCCP (5mg/kg) injection (C), mitochondria were isolated and subjected to immunoblot analysis. Representative immunoblots of parkin and SDHA in mitochondria homogenates (left) and statistical analysis of densitomeric measurement of parkin (right) is shown (*p<0.05 vs. Con/chow, #p<0.05 vs. Con/chow/starvation or CCCP, &p<0.05 vs. Con/HFD/starvation or CCCP, n=4–5). (D) Representative immunoblots of parkin and SDHA in total heart lysates (left) and statistical analysis of densitometric measurement of parkin (right) is shown (*p<0.05 vs. Con/chow, #p<0.05 vs. Con/HFD, n=5). (E) NRCMs transfected with indicated adenovirus for 72 hours were incubated with DMEM containing BSA or 0.4 mM PA for 12 hours. Representative immunoblots of parkin and SDHA in total cell lysates (left) and statistical analysis of densitometric measurement of parkin (right) is shown (*p<0.05 vs. sh-con/BSA, #p<0.05 vs. sh-con/PA, n=4). (F-G) NRCMs transfected with indicated adenovirus for 48 hours (F) or 72 hours (G) were incubated with DMEM containing BSA or 0.4 mM PA for 24 hours. The cell viability was examined (*p<0.05 vs. LacZ/BSA or sh-con/BSA, #p<0.05 vs. LacZ/PA or sh-con/PA, &p<0.05 vs. sh-ACC2/PA, n=3).
