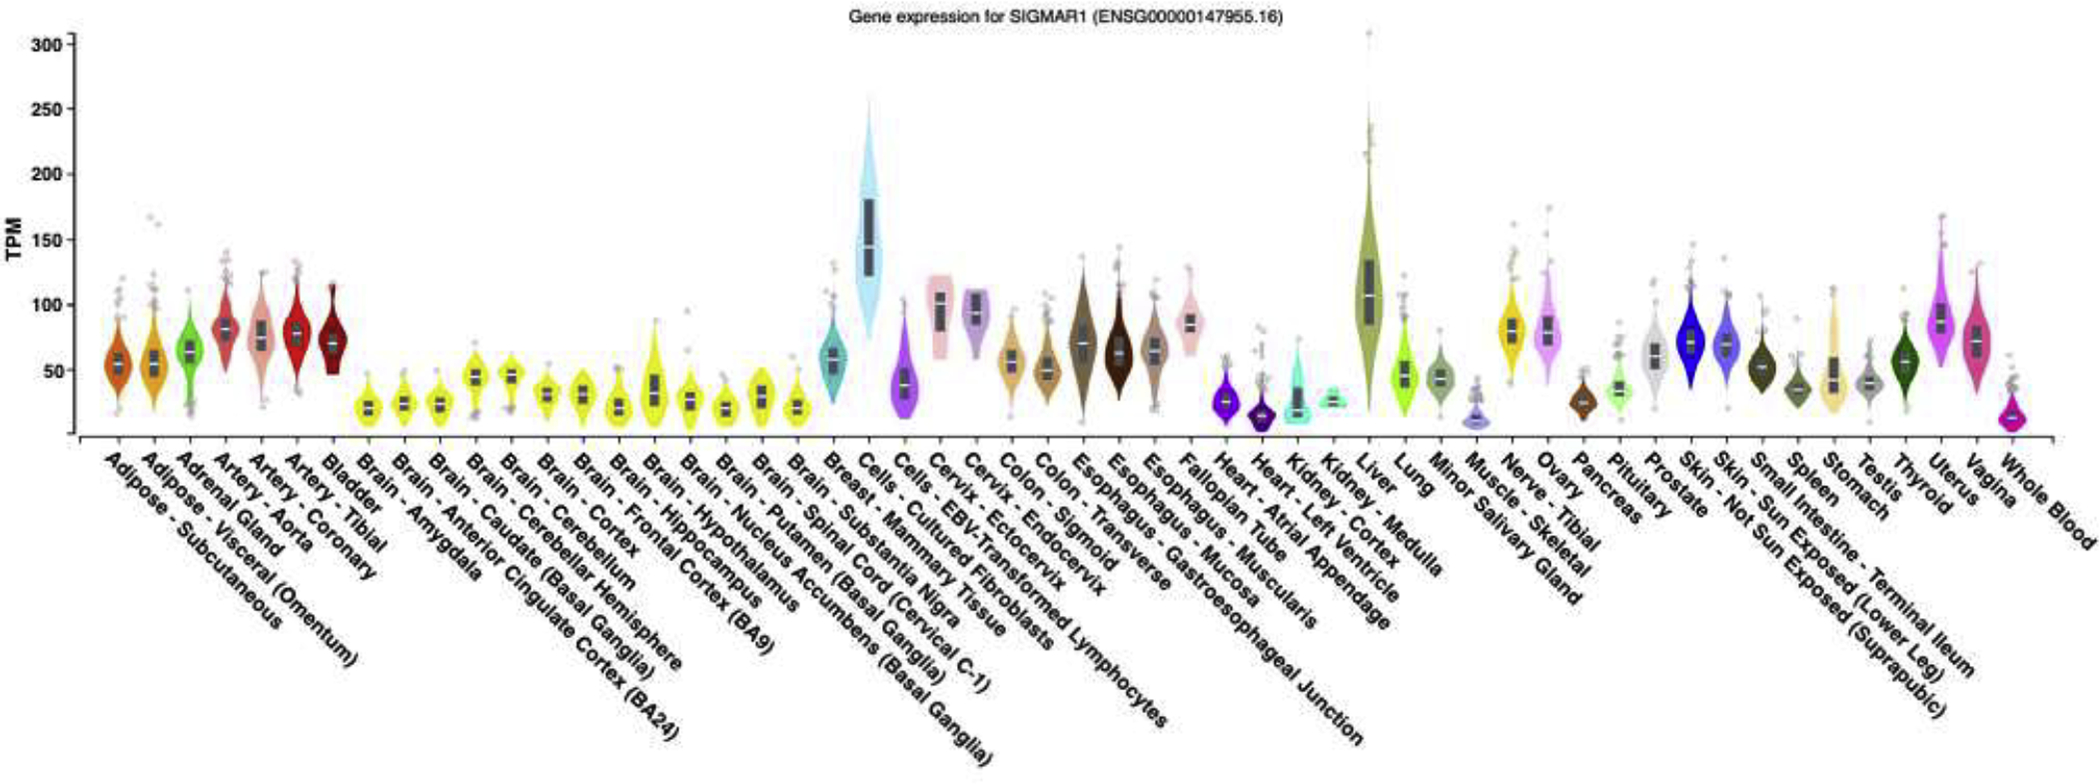
Fig. 1: Gene expression level of σ1 in different human tissues:

Data obtained from GTex portal database, GTEx Analysis Release V8 (dbGaP Accession phs000424.v8.p2). Gene code ID (ENSG00000147955.16), location chr9: 34634722–34637809. Date accessed November 18th, 2019. Gene description: sigma non-opioid intracellular receptor 1 [Source: HGNC Symbol; Acc: HGNC: 8157]. The x-axis shows different tissues tested. The y-axis represents transcripts per million (TPM). Number of examined samples for each tissue ranges from n=4 (kidney: medulla) to n=803 (skeletal muscle).
