
Figure 5. Stoichiometry and kinetics of translation machinery are perturbed without stringent response.
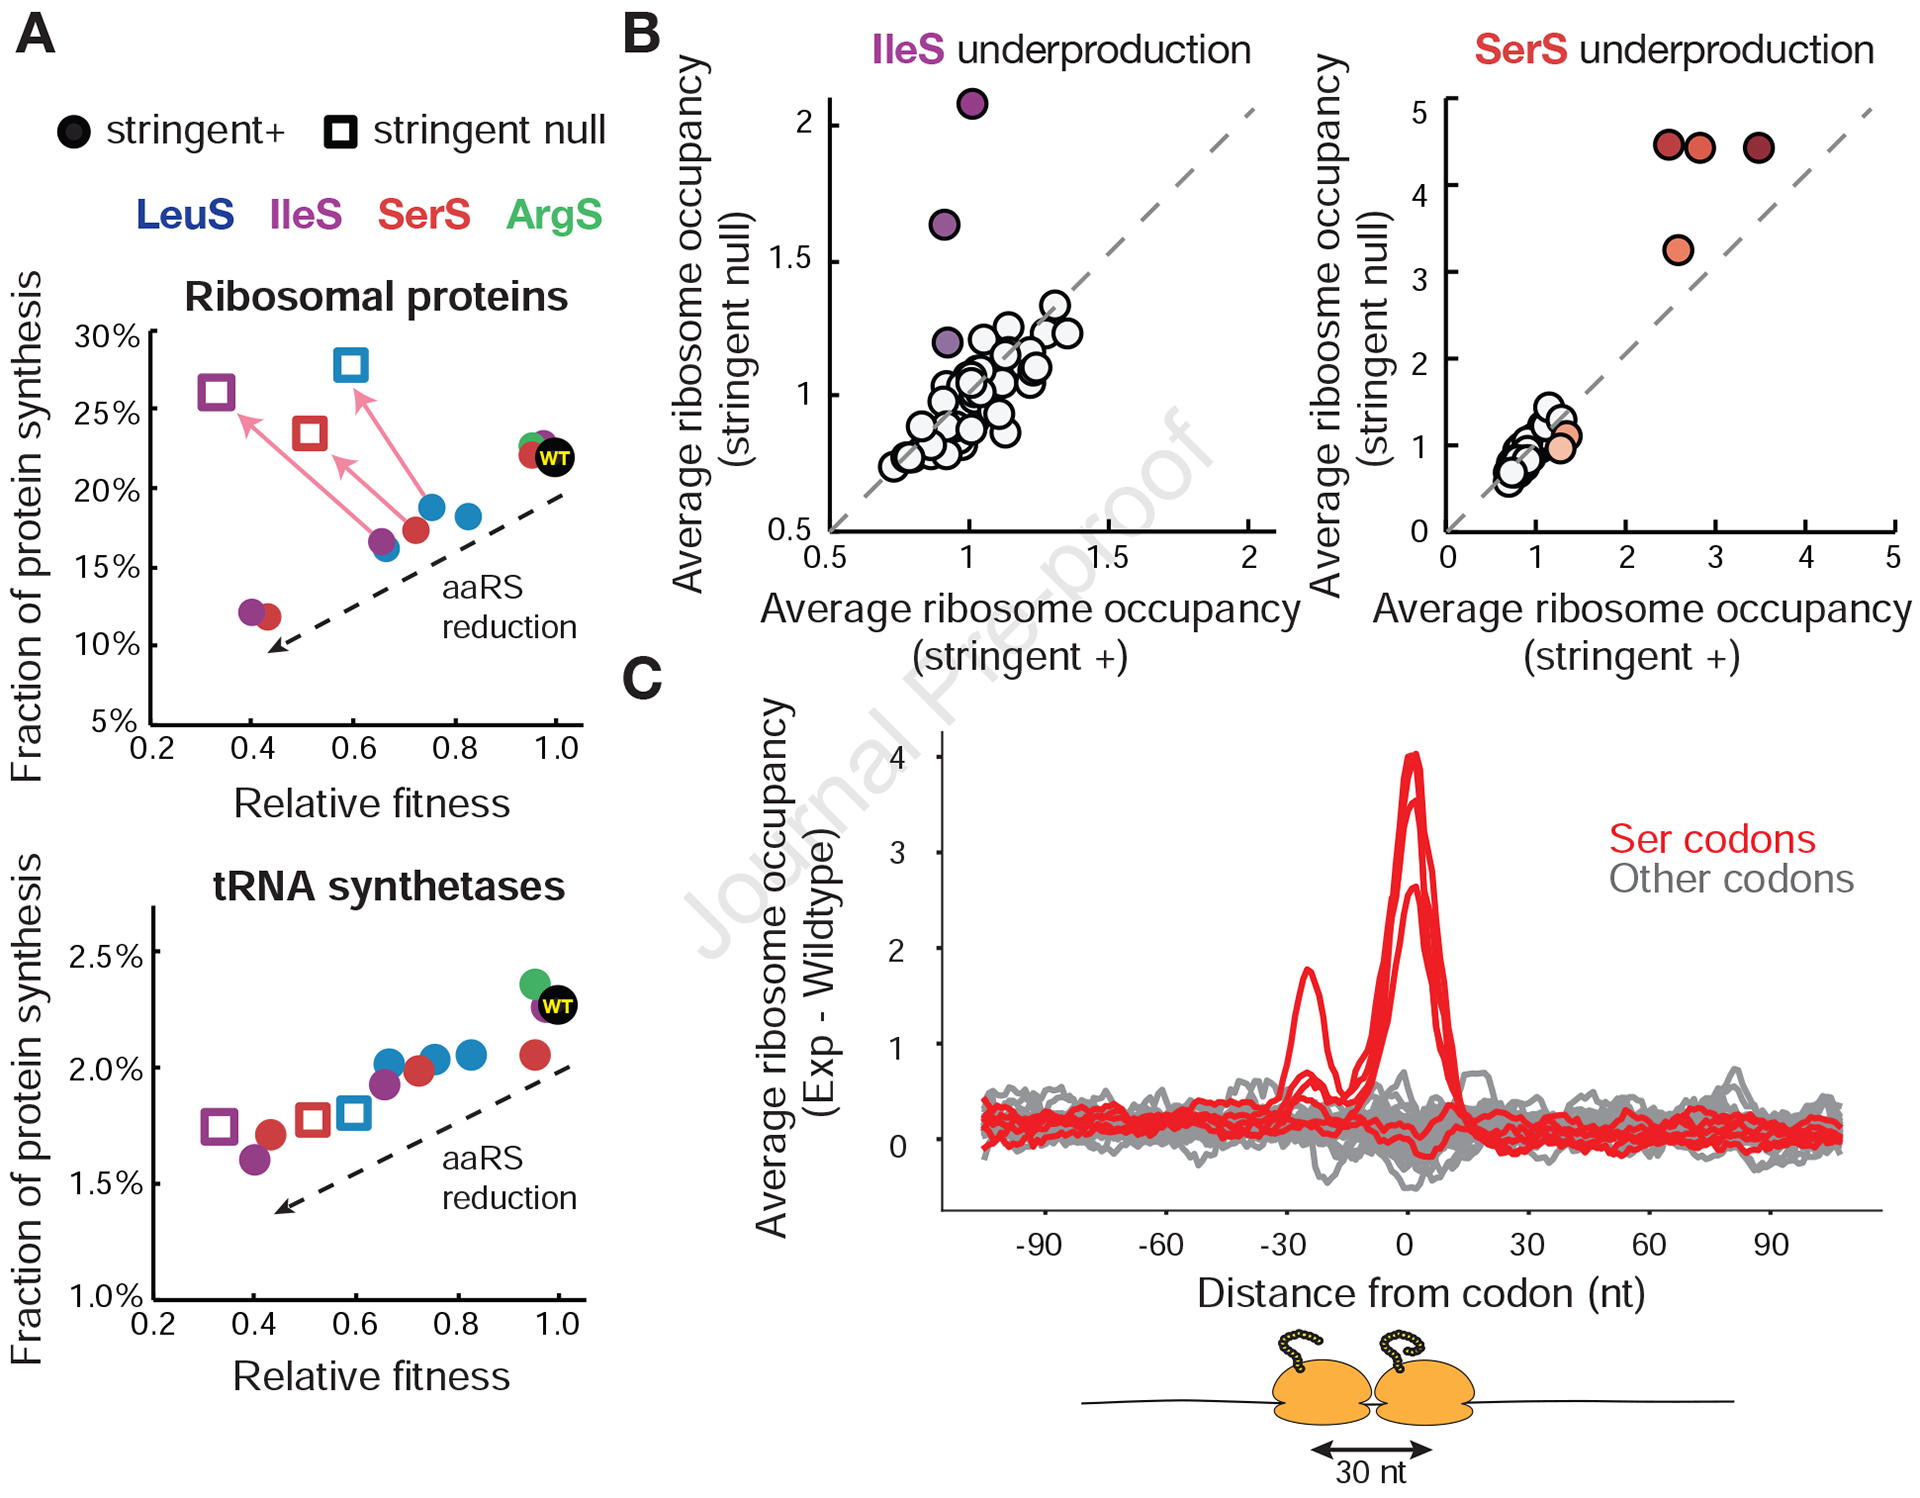
(A) Fraction of protein synthesis devoted to translation-related genes as a function of relative fitness in cells with and without the stringent response. For each inducible aaRS strain at each induction level profiled, the relative fitness as measured by the competition assay was plotted against the fraction of protein synthesis (rpkm) as measured by ribosome profiling for ribosomal proteins and aminoacyl-tRNA synthetases (STAR Methods, Table S1). Stringent positive cells are plotted as closed circles, stringent null cells as open squares. Arrows point to changes when the stringent response is removed at identical induction conditions. (B) Ribosome occupancy changes due to stringent response removal for IleS and SerS underproduction. Average codon occupancy for 61 sense codons with matched induction conditions is plotted for cells with and without the stringent response. Induction conditions lead to 0.18X and 0.12X native production levels of IleS and SerS based on calibration. Colored codons indicate cognate codons to the inducible aaRS. 310 genes for IleS induction and 218 genes for SerS induction passed the depth threshold in paired experiments and were used for analysis. (C) Metagene analysis of ribosome pausing and queuing during SerS underproduction in strains lacking the stringent response. Genes were aligned from each of the 61 codons and averaged across them. Difference in ribosome occupancy between SerS underproducing cells without the stringent response and wildtype is plotted. Red traces indicate serine codons. For full calculation see STAR Methods. See also Figure S5.