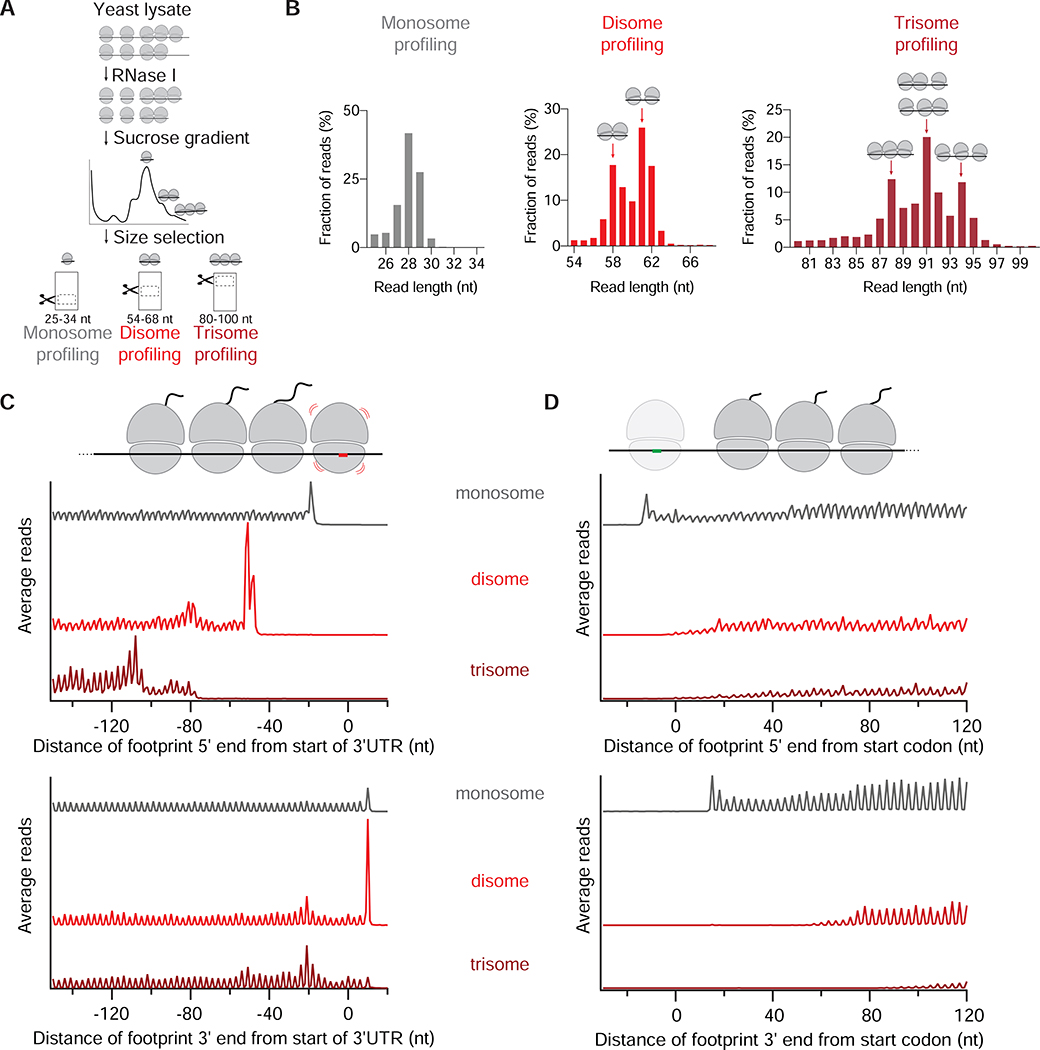
Figure 1: Disome and trisome profiling capture the distribution of collided ribosomes.
A. Schematic representation of monosome, disome and trisome profiling experiments. RNase I treatment of yeast lysate results in monosome-, disome-, and trisome-protected mRNAs, which are then separated by sucrose gradient. RNAs at the indicated size ranges are then selected by gel electrophoresis.
B. Length distribution of monosome (left), disome (middle) and trisome profiling (right) reads. Distinct peaks corresponding to 58- and 61 nt-long disome footprints, and 88-, 91- and 94 nt-long trisome footprints are indicated by arrows. The cartoons represent possible arrangement of collisions. Other replicates are shown in Figure S1B.
C. Average monosome (gray), disome (red) and trisome (dark red) reads per million (rpm) mapped to ORFs aligned by their stop codons (metagene plots). Both 5’ (top) and 3’ (bottom) end alignment of footprints from WT cells are shown. Schematic at top drawn to scale to match peaks in plots below. Other replicates are shown in Figure S1C. Figure S1D shows the plot of the disome profiling data matching the conditions of the trisome profiling.
D. Average monosome (gray), disome (red) and trisome (dark red) rpm mapped to ORFs aligned by their start codons. Note first disome/trisome reads appear ~12 nt further into ORF than monosome reads in the upper plot. On bottom plot, this ~12 nt distance is extended by the footprint size of the disome or trisome, as expected.
See also Figure S1.

