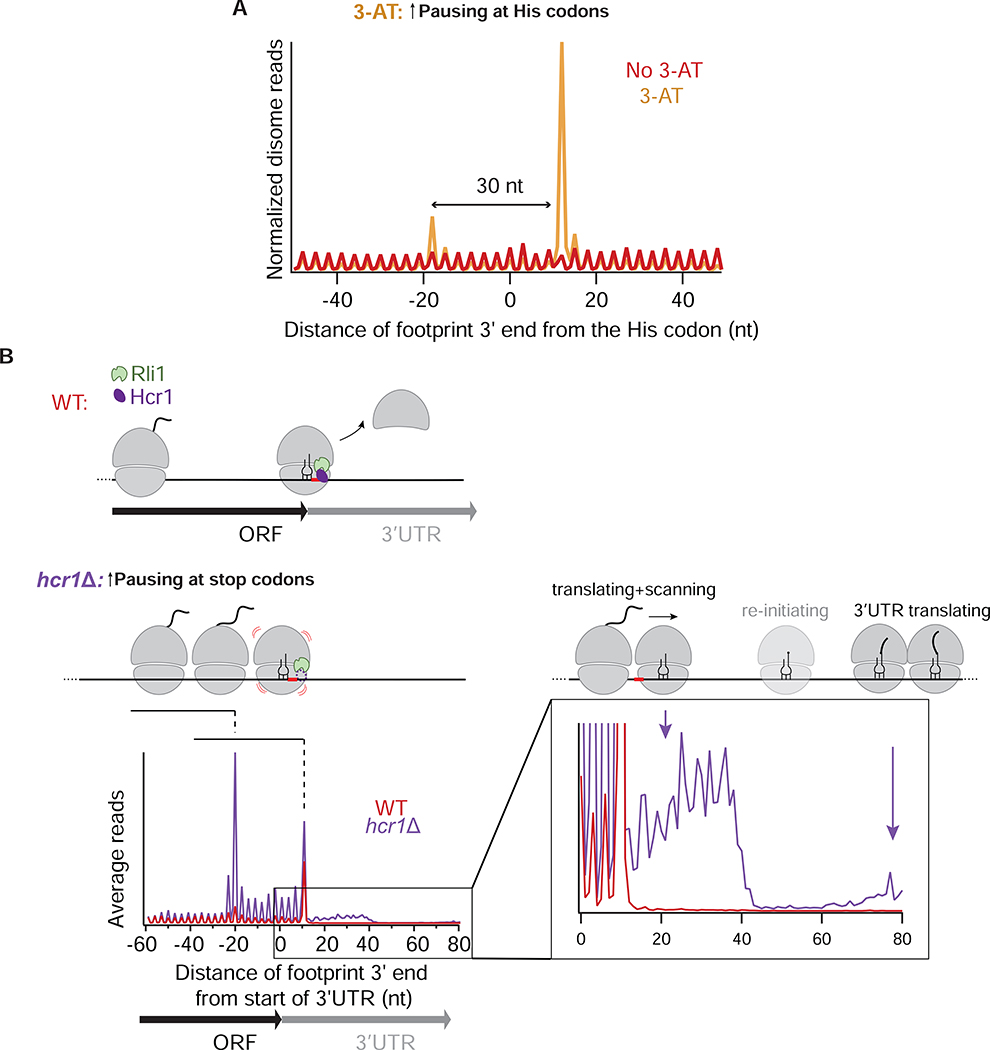
Figure 2: Cellular stress and ribosome recycling failure perturb disome distribution.
A. Average of normalized disome reads mapped to His codons in mock-treated (red) and 3-AT treated cells (orange). A queued ribosome 30 nt upstream of the main disome peak is indicated.
B. Average disome rpm mapped to ORFs aligned by their stop codons in WT (red) and hcr1Δ (purple) cells. 3’ end alignment of the footprints is shown. In hcr1Δ cells, disome occupancy is higher around the stop codon than in WT cells. Dashed lines and schematics depict individual peaks corresponding to ribosomes stacked behind the unrecycled ribosome. The stop codon is indicated in red and cartoon representations of Hcr1 and Rli1 (60S dissociation factor) are shown. Inset shows a magnified view of the 3’UTR. Distinct disome occupancy 30 nt downstream of the stop codon corresponds to a disome unit composed of an unrecycled ribosome pushed by an upstream ribosome (short arrow) (note 3-nt periodicity). These ribosomes eventually re-initiate, translate 3’UTR and form disomes further downstream in the 3’UTR (long arrow). Re-initiating monosome is shown in a lighter shade. A biological replicate is shown in Figure S2C.
See also Figure S2.

