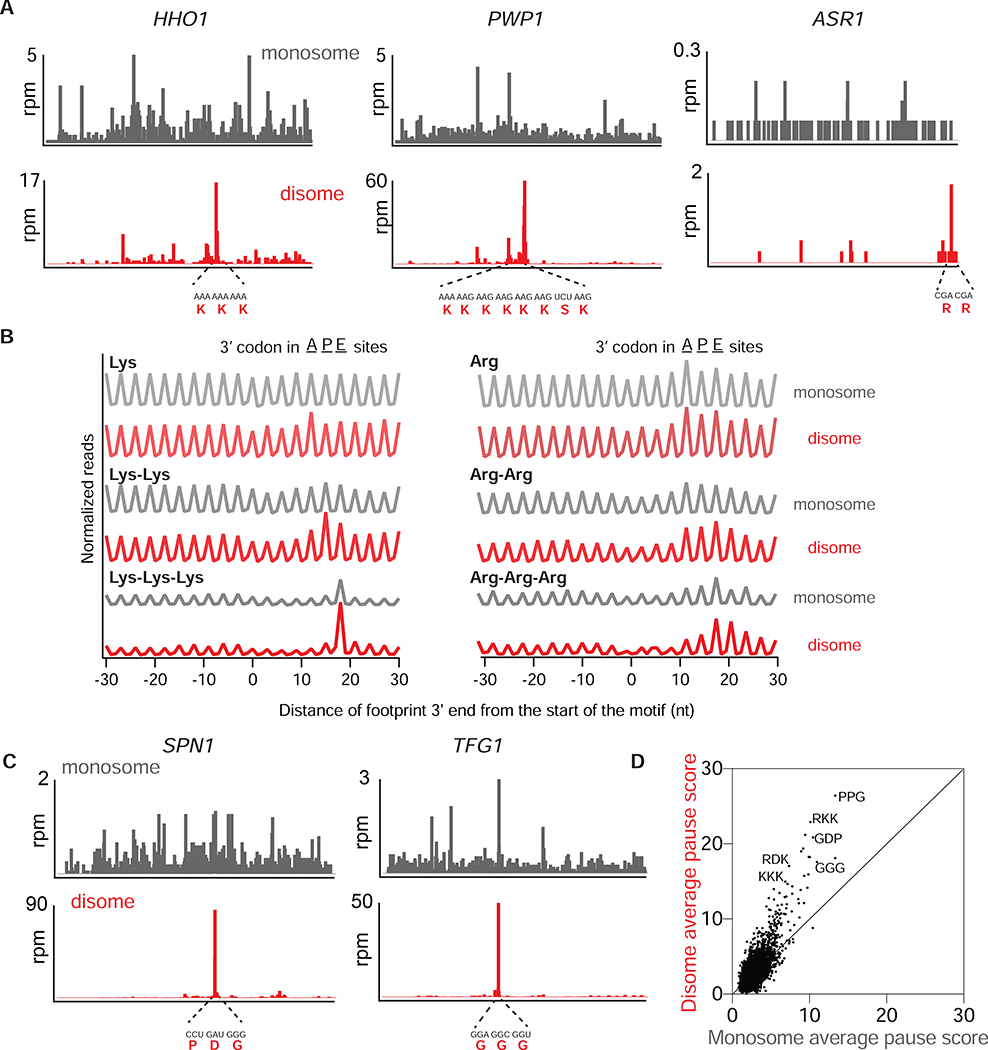
Figure 3: Disomes are enriched on a wide range of stalling motifs.
A. Monosome (gray, top) and disome (red, bottom) profiles of HHO1, PWP1 and ASR1 genes in WT cells. mRNA and amino acid sequences mapping to the disome peaks are shown in red.
B. Average, normalized monosome (gray) and disome (red) rpm mapped to single, double or triple Lys (left) and Arg (right) motifs. The positions corresponding to where the 3’ codon would be for the A, P or E site of the lead ribosome is indicated at top.
C. Monosome (gray, top) and disome (red, bottom) profiles of SPN1 and TFG1 genes.
D. Average pause scores of 6267 tripeptide motifs plotted for disome versus monosome data. Each point represents a tripeptide motif. Pause scores were calculated by applying a shift value of 18 nt from the 3’ end of the disome footprint, placing the first codon of the tripeptide motif in the E site. Some example stalling motifs are labeled on the graph.
See also Figure S3.

