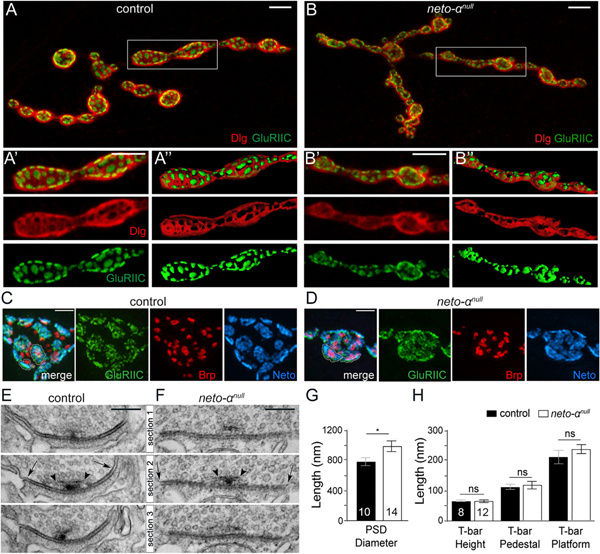
Figure 2. Neto-α Limits the Postsynaptic Receptor Fields.

(A–B”) Confocal images and 3D reconstitution of NMJ4 boutons labeled with Dlg (red) and GluRIIC (green). In control animals, Dlg-positive staining abuts on GluRIIC-marked PSDs. The borders between Dlg and GluRIIC are blurred in neto-αnull boutons (B-B”).
(C and D) 3D-SIM images of NMJ4 boutons labeled with Brp (red), GluRIIC (green), and Neto (blue). Individual PSDs are clearly separated in control boutons but are difficult to distinguish in neto-αnull.
(E and F) Serial sections of electron micrographs of single PSDs in control (E) and neto-αnull boutons (F). The longest diameters detectable in serial sections for each PSD or T-bar structure are indicated by arrows and arrowheads, respectively (E and F) and are quantified (G and H).
Scale bars: 5 μm (A and B), 1 μm (C and D), and 200 nm (E and F). Data are represented as mean ± SEM. *p < 0.05; ns, p > 0.05.
