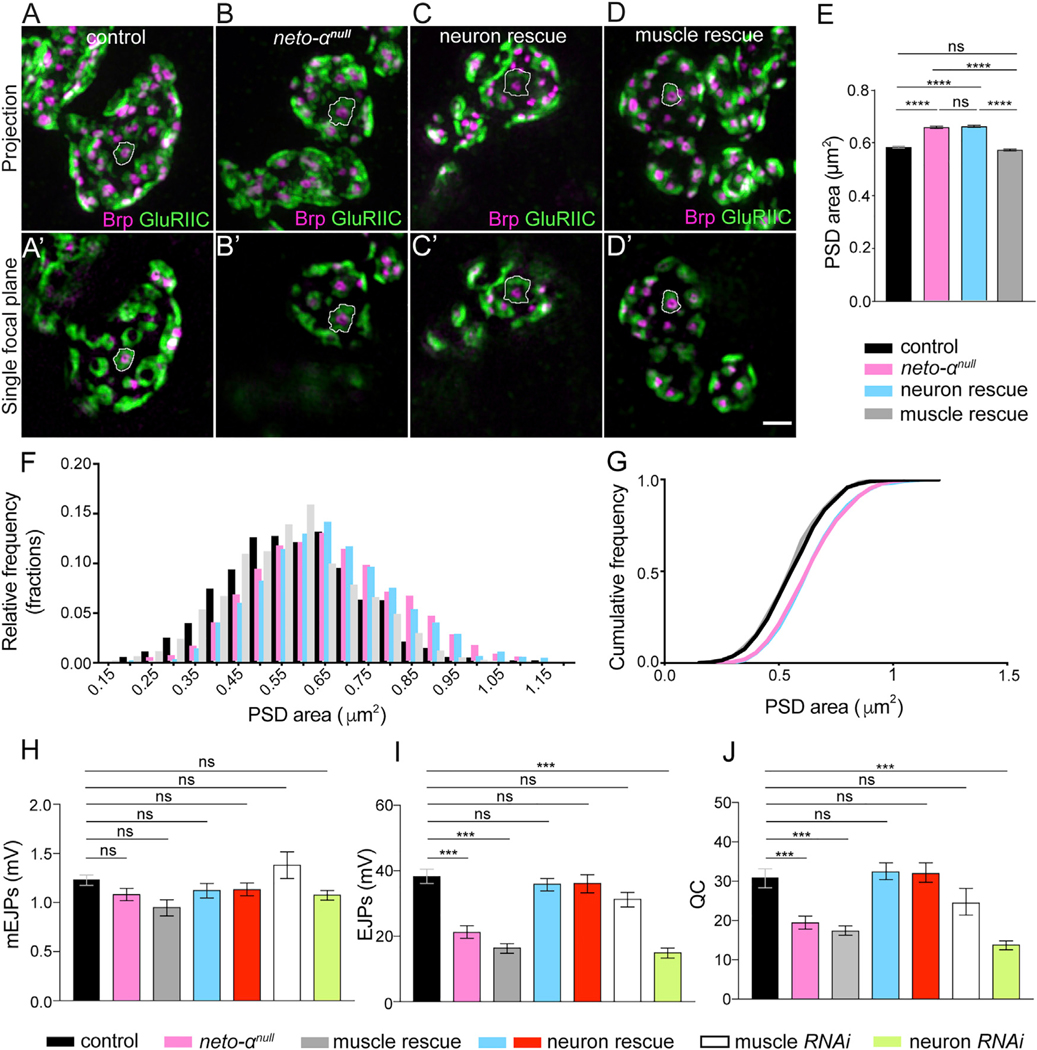
Figure 3. Neto-α Functions in Both Pre- and Postsynaptic Compartments.
(A–D) Representative 3D-SIM images (maximum intensity projection and single focal plane) of NMJ4 boutons of the indicated genotypes labeled with Brp (magenta) and GluRIIC (green).
(E) Mean individual PSD areas (white contours) are plotted. Muscle expression, but not neuronal expression, of Neto-α rescues the enlarged PSD size of neto-αnull.
(F and G) Relative and cumulative frequency distribution of different sizes of PSDs. Number of PSDs quantified: control (n = 1,600), neto-αnull (n = 1,438), neuronal rescue (n = 1,569), muscle rescue (n = 1,600).
(H–J) Summary bar graphs showing the mean amplitude of mEJPs (H), the mean amplitude of EJPs (I), and the QC (J) at NMJ6–7 of the indicated genotypes.
Scale bar: 1 μm. Error bars indicate SEM. ****p < 0.0001; ***p < 0.001; ns, p > 0.05. Genotypes: control (w1118), muscle rescue (neto-αnull;G14-Gal4/UAS-neto-α), neuron rescue (neto-αnull;OK6-Gal4/UAS-neto-α and neto-αnull,BG380-Gal4/Y;UAS-neto-α/+), muscle RNAi (G14-Gal4/+;UAS-neto-αRNAi/+), neuron RNAi (BG380-Gal4/+;;UAS-neto-αRNAi/+).

